Python数据可视化第 8 讲:matplotlib饼图绘制函数pie
1. pie 函数介绍
pie 函数用户绘制饼图。绘制饼图的数据由参数 x 提供,每个饼图楔块的分数区域为 x/sum(x) 。如果 sum(x)<1,那么 x 的值直接给出分数区域,数组将不被归一化,生成的饼图将有一个大小为 1-sum(x) 的空楔形。默认情况下,pie 函数从 x 轴开始逆时针绘制饼图楔块。pie 函数的调用格式如下:
pie(x, explode, labels, colors,**kwargs)
pie(x)
参数说明:
- x:标量序列,必须参数,其中元素决定饼图中楔块的大小。
- explode:数组,可选参数,无默认值,如果不是 None,则为长度为 len(x) 数组,该数组指定用于偏移每个楔块的半径分数。
- labels:列表,可选参数,无默认值,为每个楔块提供标签的字符串序列。
- colors:数组,可选参数,无默认值,为饼图循环所用的颜色参数序列。如果没有,将使用当前活动周期中的颜色。
- autopct:字符串或函数,可选参数,无默认值,如果不是 None,则是用于用数值标记楔块的字符串或函数。标签将放在楔块内部;如果是格式字符串,则标签为 fmt%pct;如果是函数,则调用它。
- pctdistance:浮点型,可选参数,默认值:0.6,每个饼图楔块的中心与参数 autoct 生成的文本的开始之间的比率。如果 autoct 为 None,则忽略。
- shadow:布尔型,可选参数,默认值:False,在馅饼下面画一个阴影。
- radius:浮点型,可选参数,无默认值,饼图的半径,如果“半径”为None,则将设置为1。
- labeldistance,startangle,counterclock,wedgeprops,textprops,center,frame,rotatelabels,patches,texts,autotexts等参数略。
2. pie 函数绘图示例
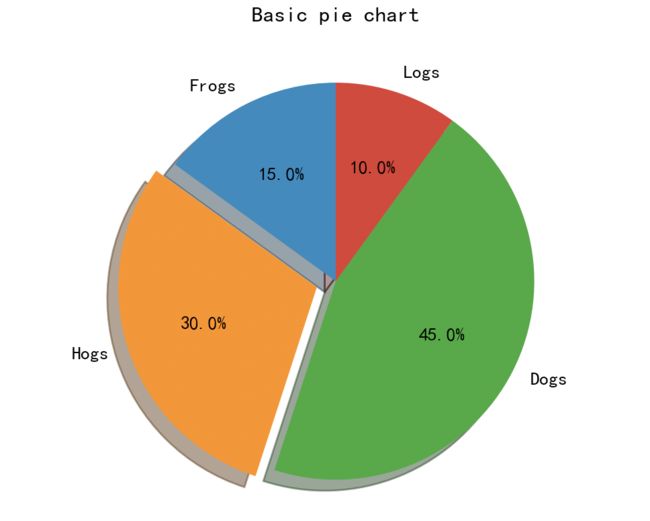
2.1 绘制一个基本的饼图
绘制一个饼图并加上一些额外的设置。除了基本的饼图之外,还显示了一些可选功能:
- 切片标签,即每个饼图楔块加上标签;
- 自动标记百分比,每个楔块所占百分比;
- 用“弹出”偏移指定楔块;
- 阴影设置;
- 自定义起始角度;
完整代码如下:
import matplotlib.pyplot as plt

# step1:准备画图的数据
labels = 'Frogs', 'Hogs', 'Dogs', 'Logs'
sizes = [15, 30, 45, 10]
explode = (0, 0.1, 0, 0)  # 控制第二个饼图楔块弹出,即Hogs弹出

# step2:手动创建一个figure对象,相当于一个空白的画布
figure = plt.figure()
# step3:在画布上添加1个子块,标定绘图位置
axes1 = plt.subplot(1, 1, 1)
# step4:绘制饼图
axes1.pie(sizes, explode=explode, labels=labels, autopct='%1.1f%%',
          shadow=True, startangle=90)
axes1.set_title('Basic pie chart')

# step5:展示
plt.show()
上面代码的运行结果:
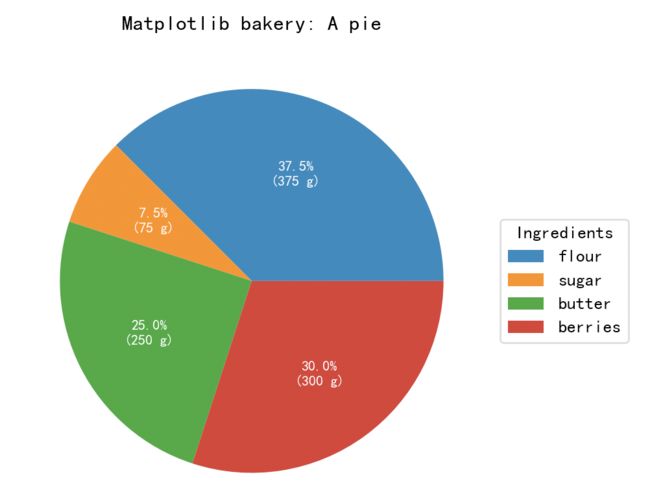
2.2 绘制饼图并用图例和注释标记各个饼块
- 首先,定义导入依赖包并为创建一个带有子块的饼图准备数据和标签列表。
- 然后,为 autoct 参数提供一个函数 func,它将通过显示绝对值来扩展自动百分比标记;我们根据相对数据和所有值的和来计算百分比。
- 最后,创建饼图并存储返回的对象以备使用。返回元组的第一个返回元素是楔块列表。那些是 matplotlib.patches.Wedge 文件修补程序,可直接用作图例的句柄。我们可以使用legend 的 bbox_to_ anchor 锚定参数将 legend 定位到饼图之外。这里我们使用轴坐标(1,0,0.5,1)和位置“中心左”;即图例的左中心点将位于边界框的左中心点,在轴坐标中从(1,0)跨越到(1.5,1)。
完整代码如下:
import matplotlib.pyplot as plt
import numpy as np

# step1:准备画图的数据
recipe = ["375 g flour",
          "75 g sugar",
          "250 g butter",
          "300 g berries"]

data = [float(x.split()[0]) for x in recipe]
ingredients = [x.split()[-1] for x in recipe]

# 自定义一个函数,用于计算每个饼块所占的百分比,并拼接文本
def func(pct, allvals):
    # 计算百分比
    absolute = int(pct / 100. * np.sum(allvals))
    # 按格式拼接饼块展示文本
    return "{:.1f}%\n({:d} g)".format(pct, absolute)

# step2:手动创建一个figure对象,相当于一个空白的画布
figure = plt.figure()
# step3:在画布上添加1个子块,标定绘图位置
axes1 = plt.subplot(1, 1, 1)
# step4:绘制饼图,通过参数autopct指定的字符串标记楔块
wedges, texts, autotexts = axes1.pie(data, autopct=lambda pct: func(pct, data),
                                     textprops=dict(color="w"))
# step5:绘制图例
axes1.legend(wedges, ingredients,
             title="Ingredients",
             loc="center left",
             bbox_to_anchor=(1, 0, 0.5, 1))

# step6:设置饼图文本格式和标题
plt.setp(autotexts, size=8, weight="bold")
axes1.set_title("Matplotlib bakery: A pie")

# step7:展示
plt.show()
上面代码的运行结果: