DS Wannabe之5-AM Project: DS 30day int prep day10
Q1. What is a Recommender System?
A recommender system is today widely deployed in multiple fields like movie recommendations, music preferences, social tags, research articles, search queries and so on. The recommender systems work as per collaborative and content-based filtering or by deploying a personality-based approach. This type of system works based on a person’s past behavior in order to build a model for the future. This will predict the future product buying, movie viewing or book reading by people. It also creates a filtering approach using the discrete characteristics of items while recommending additional items.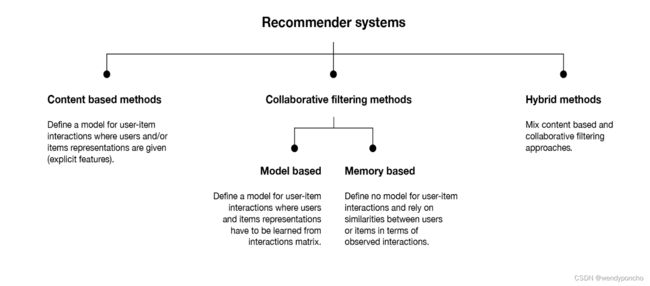
Q4. What is Interpolation and Extrapolation?
The terms of interpolation and extrapolation are extremely important in any statistical analysis. Extrapolation is the determination or estimation using a known set of values or facts by extending it and taking it to an area or region that is unknown. It is the technique of inferring something using data that is available.
Interpolation on the other hand is the method of determining a certain value which falls between a certain set of values or the sequence of values. This is especially useful when you have data at the two extremities of a certain region but you don’t have enough data points at the specific point. This is when you deploy interpolation to determine the value that you need.
Q5. What does P-value signify about the statistical data?
P-value is used to determine the significance of results after a hypothesis test in statistics. P-value helps the readers to draw conclusions and is always between 0 and 1.
• P- Value > 0.05 denotes weak evidence against the null hypothesis which means the null hypothesis cannot be rejected.
• P-value <= 0.05 denotes strong evidence against the null hypothesis which means the null hypothesis can be rejected.
• P-value=0.05is the marginal value indicating it is possible to go either way.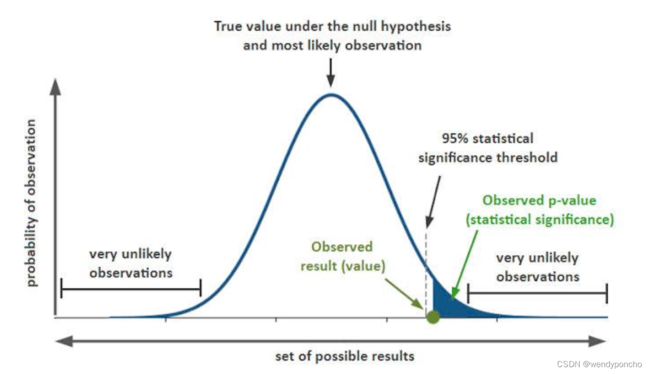
Q6. During analysis, how do you treat missing values?
The extent of the missing values is identified after identifying the variables with missing values. If any patterns are identified the analyst has to concentrate on them as it could lead to interesting and meaningful business insights. If there are no patterns identified, then the missing values can be substituted with mean or median values (imputation) or they can simply be ignored.
There are various factors to be considered when answering this question-
Understand the problem statement, understand the data and then give the answer.Assigning a default value which can be mean, minimum or maximum value. Getting into the data is important.
If it is a categorical variable, the default value is assigned. The missing value is assigned a default value.
If you have a distribution of data coming, for normal distribution give the mean value.
Should we even treat missing values is another important point to consider?
Drop Observation
consists of delteing the observations which contain at least one missing feature.
If 80% of the values for a variable are missing then you can answer that you would be dropping the variable instead of treating the missing values.
Q7. Explain the difference between a Test Set and a Validation Set?
Validation set can be considered as a part of the training set as it is used for parameter selection and to avoid Overfitting of the model being built. On the other hand, test set is used for testing or evaluating the performance of a trained machine leaning model.
In simple terms ,the differences can be summarized as- Training Set is to fit the parameters i.e. weights.
Test Set is to assess the performance of the model i.e. evaluating the predictive power and generalization.
Validation set is to tune the parameters.
Q8. What is the curse of dimensionality? Can you list some ways to deal with it?
The curse of dimensionality is when the training data has a high feature count, but the dataset does not have enough samples for a model to learn correctly from so many features. For example, a training dataset of 100 samples with 100 features will be very hard to learn from because the model will find random relations between the features and the target. However, if we had a dataset of 100k samples with 100 features, the model could probably learn the correct relationships between the features and the target.
There are different options to fight the curse of dimensionality:
-
Feature selection. Instead of using all the features, we can train on a smaller subset of features.
-
Dimensionality reduction. There are many techniques that allow to reduce the dimensionality
of the features. Principal component analysis (PCA) and using autoencoders are examples of dimensionality reduction techniques.
-
L1 regularization. Because it produces sparse parameters, L1 helps to deal with high-
dimensionality input.
-
Feature engineering. It’s possible to create new features that sum up multiple existing
features. For example, we can get statistics such as the mean or median.
Q9. What is data augmentation? Can you give some examples?
Data augmentation is a technique for synthesizing new data by modifying existing data in such a way that the target is not changed, or it is changed in a known way.
Computer vision is one of fields where data augmentation is very useful. There are many modifications that we can do to images:
- Resize
- Horizontal or vertical flip Rotate
- Add noise
- Deform
- Modify colors
Each problem needs a customized data augmentation pipeline. For example, on OCR, doing flips will change the text and won’t be beneficial; however, resizes and small rotations may help.
Q10. What is stratified cross-validation and when should we use it?
Cross-validation is a technique for dividing data between training and validation sets.
On typical cross-validation this split is done randomly. But in stratified cross-validation, the split preserves the ratio of the categories on both the training and validation datasets.
For example, if we have a dataset with 10% of category A and 90% of category B, and we use stratified cross-validation, we will have the same proportions in training and validation. In contrast, if we use simple cross-validation, in the worst case we may find that there are no samples of category A in the validation set.
Stratified cross-validation may be applied in the following scenarios:
-
On a dataset with multiple categories. The smaller the dataset and the more imbalanced the categories, the more important it will be to use stratified cross-validation.
-
On a dataset with data of different distributions. For example, in a dataset for autonomous driving, we may have images taken during the day and at night. If we do not ensure that both types are present in training and validation, we will have generalization problems.