【Python基础】文件详解(文件基础、csv文件、时间处理、目录处理、excel文件、json&picke、ini配置文件)
文章目录
- (一)文件详解
-
- 1 快速入门文件操作
-
- 1.1 快速实现文件读取
- 1.2 快速实现文件写入
- 2 文件打开方式详解
-
- 2.1 open方法
- 2.2 打开方式
- 2.3 文件读写操作
-
- 2.3.1 基本读写
- 2.3.2 读写方式打开
- 2.3.3 实现重复读取
- 3 文件编码问题
- 4 文件读写方法
-
- 4.1 文件读取方式
- 4.2 文件写入方式
- 5 文件练习
-
- 5.1 产生销售数据
- 5.2 根据条件过滤数据
- 5.3 数据统计
- 5.4 课后练习
- (二)csv 文件详解
-
- 1 csv文件详解与应用
-
- 1.1 csv文件
- 1.2 准备工作
- 2 csv模块详解
-
- 2.1 csv快速上手
- 2.2 csv读取两种方式
- 2.3 writer方式写入
- 2.4 csv写入空白行问题
- 2.5 DictWriter方式写入
- 3 csv 文件练习
-
- 3.1 基本信息统计
- 3.2 按照年份统计出生率与死亡率
- 3.3 将指定年份保存
- (三)时间处理
-
- 1 时间处理
- 2 time模块
-
- 2.1 时间戳(timestamp)
- 2.2 struct_time
- 2.3 时间戳与struct_time转化
- 2.4 字符串时间与struct_time转化
- 3 datetime模块
- 4 calendar模块
- 5 案例
-
- 5.1 理解需求
- 5.2 需求1:按年月统计
-
- 5.2.1时间处理
- 5.2.2 功能实现
- 5.3 需求2:统计7天内数据
-
- 5.3.1 时间处理
- 5.3.2 计算时间差
- 5.3.3 代码实现
- (四)文件与目录处理
-
- 1 文件与目录处理
- 2 目录操作
- (五)excel文件详解
-
- 1 excel文件
-
- 1.1 excel操作过程
- 1.2 打开关闭excel文件
- 1.3 excel内容读取
- 1.4 iter_cols与iter_rows说明
- 1.5 练习
- 1.6 Excel写入
- 2 练习
-
- 2.1 按照省份统计
- 2.2 按照省份进行拆分
- 3 excel格式设置
-
- 3.1 字体设置
- 3.2 单元格设置
- 3.3 格式设置练习
- 3.4 销售数据练习
- 4 excel公式与图表应用
-
- 4.1 公式应用
- 6 excel插入图表
- (六)json 与 picke
-
- 1 序列化与反序列化
- 2 Json
-
- 2.1 Json简介
- 2.2 Json模块及主要方法
- 2.3 Json练习
- 3 pickle模块
-
- 3.1 pickle模块及主要方法
- 3.2 pickle练习
- (七)ini配置文件处理
-
- 1 .ini文件格式
- 2 configparser模块
-
- 2.1 读取相关方法
- 2.2 读取操作
-
- 2.2.1 打开文件
- 2.2.2 读取session
- 2.2.3 section与key判断
- 2.2.4 读取值
- 2.3 ini文件写入
-
- 2.3.1 创建ConfigParser对象
- 2.3.2 添加sesction
- 2.3.3 添加key_value
- 2.3.4 保存到文件
(一)文件详解
1 快速入门文件操作
- 打开文件
- 读取文件
- 写入文件
- 关闭文件
1.1 快速实现文件读取
准备工作:在本地准备文本文件
#文件路径
fpath = r"data\test.txt"
#打开文件
f = open(fpath, encoding="utf-8")
#使用read方法读取文件所有了内容
text = f.read()
print(text)
#关闭文件
f.close()
职场人要坚持锻炼身体,时刻关注自己的健康,
尤其30岁以后,注意健康饮食,配合适量运动,
保持内心的平和,懂的给自己减压,保持良好的睡眠
1.2 快速实现文件写入
准备工作:准备写入文件路径,建议写新文件
#文件路径
fpath = r"data\write_test.txt"
#只写方式打开文件
f = open(fpath, "w")
#写入文件
line = "人生苦短,我用Python"
text = f.write(line)
f.close()
2 文件打开方式详解
2.1 open方法
open(file, mode=‘r’, buffering=-1, encoding=None, errors=None, newline=None,
closefd=True, opener=None)
| 参数 | 说明 |
|---|---|
file |
文件路径名称。 |
mode |
打开方式。 |
buffering |
缓存机制。1 表示使用缓存机制,-1 表示使用系统默认,0 表示不使用缓存机制(仅对 Binary 有效)。 |
encoding |
编码格式。 |
newline |
换行符。 |
2.2 打开方式
文件打开模式:
| 模式 | 说明 |
|---|---|
r |
只读模式,打开后不能执行写操作。 |
w |
只写模式,文件存在被清空,打开后不能执行读操作。 |
x |
创建新文件,以只写方式打开,若文件存在报错。 |
a |
追加模式。 |
+ |
读写方式打开。 |
r+ |
读写方式打开。 |
w+ |
读写方式打开,文件存在被清空。 |
| 二进制方式 | rb, wb, xb, rb+, wb+ 等,场景:图片,二进制文件等。 |
2.3 文件读写操作
2.3.1 基本读写
- 以“w“方式打开文件,会将当前的文件清空;
- 写文件换行,需要在行尾添加“\n”;
#定义读取函数
def read_file(fpath):
    f = open(fpath)
    content = f.read()
    if content:
        print(content)
    else:
        print("文件内容为空")
    f.close()

#定义写入函数
def write_file(fpath, content = ""):
    fw = open(fpath, "w")
    if content:
        text = fw.write(content)
    fw.close()

#文件路径
fpath = r"data\write_only.txt"
#写入内容
line = "人生苦短,我用Python"

#打开文件并写入一行
write_file(fpath, line)
#写入第二行
write_file(fpath, line)
#读取文件内容
read_file(fpath)

#只打开文件,不写入数据
write_file(fpath)
#读取文件内容
read_file(fpath)
人生苦短,我用Python
文件内容为空
2.3.2 读写方式打开
文件以r+或者w+方式打开
以w+方式打开,文件内容清空
fpath = r"data\write_read.txt"
#打开文件
f = open(fpath, "w+")
line = "人生苦短,我用Python"
#写入数据
text = f.write(line)
#重置读取位置
f.seek(0, 0)
#读取写入内容
print(f.read())
f.close()
人生苦短,我用Python
以r+方式打开:
fpath = r"data\write_read.txt"
#打开文件
f = open(fpath, "r+")
#读取文件内容
print(f.read())
line = "自律"
#在文件尾部追加
f.write(line)
#重置读取位置
f.seek(0, 0)
#读取写入内容
print(f.read())
f.close()
人生苦短,我用Python
人生苦短,我用Python自律
2.3.3 实现重复读取
实现思路:
- 文件读取完成后,关闭文件并重新打开;
- 使用seek方法,重置读取位置;
fpath = r"data\test.txt"
f = open(fpath, "r+",encoding="utf-8")
print(f.read())
print(f.read())
职场人要坚持锻炼身体,时刻关注自己的健康,
尤其30岁以后,注意健康饮食,配合适量运动,
保持内心的平和,懂的给自己减压,保持良好的睡眠
# 重复打开实现方式
fpath = r"data\test.txt"
#第一次读取
f = open(fpath, encoding="utf-8")
text = f.read()
print(text)
f.close()
#第二次读取
f = open(fpath, encoding="utf-8")
text = f.read()
print(text)
f.close()
职场人要坚持锻炼身体,时刻关注自己的健康,
尤其30岁以后,注意健康饮食,配合适量运动,
保持内心的平和,懂的给自己减压,保持良好的睡眠
职场人要坚持锻炼身体,时刻关注自己的健康,
尤其30岁以后,注意健康饮食,配合适量运动,
保持内心的平和,懂的给自己减压,保持良好的睡眠
# 使用seek重置位置
fpath = r"data\test.txt"
#打开文件
f = open(fpath, encoding="utf-8")
#设置读取次数
for i in range(3):
    #第一次读取
    text = f.read()
    print(text)
    #读取完成后,重置读取位置
    f.seek(0, 0)
职场人要坚持锻炼身体,时刻关注自己的健康,
尤其30岁以后,注意健康饮食,配合适量运动,
保持内心的平和,懂的给自己减压,保持良好的睡眠
职场人要坚持锻炼身体,时刻关注自己的健康,
尤其30岁以后,注意健康饮食,配合适量运动,
保持内心的平和,懂的给自己减压,保持良好的睡眠
职场人要坚持锻炼身体,时刻关注自己的健康,
尤其30岁以后,注意健康饮食,配合适量运动,
保持内心的平和,懂的给自己减压,保持良好的睡眠
3 文件编码问题
文件写入与读取:
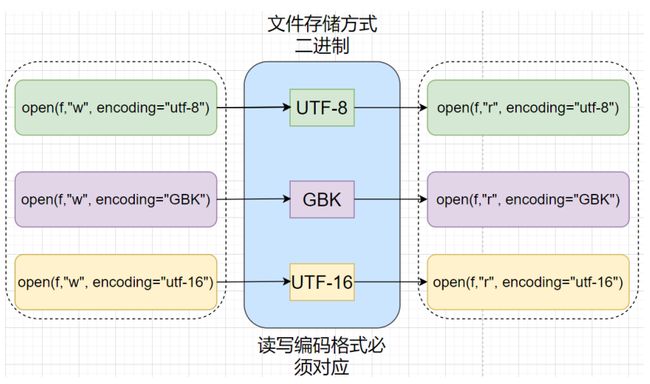
window下默认编码格式:cp936,测试方法:
fpath = r"data\encode_test.txt"
f = open(fpath, 'w')
line = "床前明月光"
f.write(line)
print(f)
f.close()
<_io.TextIOWrapper name='data\\encode_test.txt' mode='w' encoding='utf-8'>
fpath = r"data\encode_test.txt"
f = open(fpath, 'r', encoding="utf-8")
f.read()
'床前明月光'
查看文件编码格式
import chardet

def detect_encoding(file_path):
    with open(file_path, 'rb') as f:
        result = chardet.detect(f.read())
        return result['encoding']
修改文件编码格式
import chardet

def change_file_encoding(file, new_encoding):
    # 检测文件的原始编码格式
    with open(file, "rb") as f:
        data = f.read()
        old_encoding = chardet.detect(data)["encoding"]
    # 读取文件内容并转换为新的编码格式
    with open(file, "r", encoding=old_encoding) as f:
        content = f.read()
        new_content = content.encode(new_encoding)
    # 用新的编码格式覆盖写入文件
    with open(file, "wb") as f:
        f.write(new_content)
注意:
- 只读打开文件,设置编码格式要与其保存格式一致
- 一般看到打开文件,读取时遇到"UnicodeDecodeError"问题,需要检查设置的编码格式
4 文件读写方法
4.1 文件读取方式
主要方法:
| 方法 | 说明 |
|---|---|
f.read(size=-1) |
读取文件内容,默认读取完。 |
f.readline(size=-1) |
读取一行,读取到 EOF 或者新的一行结束。 |
f.readlines(hint=-1) |
读取多行。 |
for line in f: pass |
使用 for 循环逐行遍历文件。 |
4.2 文件写入方式
主要方法:
| 方法 | 说明 |
|---|---|
f.write(text) |
写入数据。 |
f.writelines(lines) |
一次写入多行。 |
5 文件练习
5.1 产生销售数据
需求:给定三个指定商品(pr001, pr002, pr003),渠道(channel1, channel2, channel3),销售额(1~40
之间随机数),产生30条销售数据;
实现思路:
- 分析文件格式,
- 分析使用知识点,
- 代码实现与调试,
- 封装成函数,
import random
def gen_sales_report(fpath, nums = 30):
    #只写方式打开文件
    fw = open(fpath, "w")
    #定义商品ID
    goodids = ["pr001", "pr002", "pr003"]
    #定义渠道
    channels = ["channel1", "channel2", "channel3"]
    max_value, min_value = 40, 10
    for i in range(30):
        #商品ID
        goodid = random.choice(goodids)
        #渠道ID
        chid = random.choice(channels)
        #销售额
        value = random.randint(min_value, max_value)
        #拼接一行数据
        line = f"{goodid} {chid} {value}\n"
        #print(line)
        #写入数据
        fw.write(line)
    fw.close()

fpath = r"data\sales_report.txt"
gen_sales_report(fpath)
f = open(fpath, 'r', encoding="utf-8")
f.read()
'pr002 channel2 13\npr002 channel3 18\npr003 channel3 18\npr001 channel3 32\npr002 channel1 12\npr002 channel2 34\npr002 channel2 20\npr001 channel3 33\npr001 channel3 23\npr002 channel2 38\npr003 channel2 10\npr001 channel1 30\npr003 channel1 19\npr003 channel3 39\npr003 channel1 34\npr001 channel1 20\npr003 channel3 22\npr003 channel3 17\npr003 channel3 15\npr002 channel3 40\npr002 channel3 14\npr001 channel2 40\npr003 channel1 25\npr002 channel1 11\npr002 channel3 16\npr001 channel1 19\npr003 channel2 39\npr001 channel2 39\npr002 channel3 25\npr001 channel2 25\n'
5.2 根据条件过滤数据
需求:按照条件进行过滤,并数据保存到新文件中
实现思路:
- 读取数据
- 根据条件筛选数据,并记录符合条件数据
- 将数据写入对应的文件
#销售数据
fpath = r"data\sales_report.txt"
#过滤结果
pr001_report = r"data\pr001_sales_report.txt"

def filer_report_by_product(in_fpath, out_fpath, product):
    #打开销售数据
    f = open(in_fpath)
    #创建新文件,保存过滤数据
    fw = open(out_fpath, "w")
    for line in f:
        if line.startswith(product):
            print(line, end="")
            fw.write(line)
    f.close()
    fw.close()

#过滤pr001的数据
filer_report_by_product(fpath, pr001_report, "pr001")
pr001 channel3 32
pr001 channel3 33
pr001 channel3 23
pr001 channel1 30
pr001 channel1 20
pr001 channel2 40
pr001 channel1 19
pr001 channel2 39
pr001 channel2 25
5.3 数据统计
统计每个渠道,每个商品,总销售额;
注意:假设渠道,商品数量未知;
- 统计每个渠道销售额,统计每个商品销售额;
- 数据结构设计,
- 统计思路及代码实现
from collections import Counter

def read_report(in_fpath):
    #打开销售数据
    f = open(in_fpath)
    #切分数据
    items = [line.strip().split() for line in f if line.strip()]
    f.close()
    return items

def analyse_data_by_product(items):
    #使用Counter进行统计
    counter = Counter()
    #遍历数据
    for product, _, price in items:
        #按商品统计销售额
        counter[product] += float(price)
    return counter

def analyse_data_by_channel(items):
    #使用Counter进行统计
    counter = Counter()
    #遍历数据
    for product, ch, price in items:
        #按商品统计销售额
        counter[ch] += float(price)
    return counter

fpath = r"data\sales_report.txt"
#解析数据
data = read_report(fpath)
#商品及销售额
product_result = analyse_data_by_product(data)
print("商品统计数据:")
for item in product_result.items():
    print(item)
#渠道及销售额
print("渠道销售数据")
channel_result = analyse_data_by_channel(data)
for item in channel_result.items():
    print(item)
商品统计数据:
('pr002', 241.0)
('pr003', 238.0)
('pr001', 261.0)
渠道销售数据
('channel2', 258.0)
('channel3', 312.0)
('channel1', 170.0)
5.4 课后练习
- 按商品统计订单量,
- 按渠道统计订单量,
- 按商品统计每单成交的平均价格,
- 按渠道统计每单成交的平均价格,
(二)csv 文件详解
1 csv文件详解与应用
1.1 csv文件
csv文件:使用纯文本来存储表格数据,并以指定的分隔符进行分隔,csv的第一行一般为列名;
常见场景:天池,Kaagle等平台,提供开源数据多为csv文件;
1.2 准备工作
- 某年中国人口统计数据集(china_stastic.csv);
- 俄罗斯人口统计数据集(russian_demography.csv);
2 csv模块详解
主要内容:
- csv模块及对应方法;
- csv文件读取;
- csv文件写入;
2.1 csv快速上手
csv_reader主要参数:
| 参数 | 说明 |
|---|---|
delimiter |
字段分隔符,默认为逗号 “,”。 |
lineterminator |
换行符,默认为 “\r\n”(回车换行)。 |
quotechar |
用于包含有特殊字符字段的引号,默认为双引号。 |
quoting |
写文件时控制引号行为。 |
quoting 主要字段:
| 参数 | 说明 |
|---|---|
csv.QUOTE_NONNUMERIC |
数字加引号。 |
csv.QUOTE_ALL |
所有字段加引号。 |
csv.QUOTE_MINIMAL |
特殊字段加引号。 |
csv.QUOTE_NONE |
都不加引号。 |
#导入模块
import csv
fpath = r"data\china_stastic.csv"
#打开文件
f = open(fpath,encoding="UTF-8-SIG")
#创建reader对象
csv_reader = csv.reader(f)
#逐行读取文件
for row in csv_reader:
    print(row)
#关闭文件
f.close()
['area', 'count', '2020比重', '2010比重']
['全国[5]', '1411778724', '100', '100']
['北京', '21893095', '1.55', '1.46']
['天津', '13866009', '0.98', '0.97']
['河北', '74610235', '5.28', '5.36']
['山西', '34915616', '2.47', '2.67']
['内蒙古', '24049155', '1.7', '1.84']
['辽宁', '42591407', '3.02', '3.27']
['吉林', '24073453', '1.71', '2.05']
['黑龙江', '31850088', '2.26', '2.86']
['上海', '24870895', '1.76', '1.72']
['江苏', '84748016', '6', '5.87']
['浙江', '64567588', '4.57', '4.06']
['安徽', '61027171', '4.32', '4.44']
['福建', '41540086', '2.94', '2.75']
['江西', '45188635', '3.2', '3.33']
['山东', '101527453', '7.19', '7.15']
['河南', '99365519', '7.04', '7.02']
['湖北', '57752557', '4.09', '4.27']
['湖南', '66444864', '4.71', '4.9']
['广东', '126012510', '8.93', '7.79']
['广西', '50126804', '3.55', '3.44']
['海南', '10081232', '0.71', '0.65']
['重庆', '32054159', '2.27', '2.15']
['四川', '83674866', '5.93', '6']
['贵州', '38562148', '2.73', '2.59']
['云南', '47209277', '3.34', '3.43']
['西藏', '3648100', '0.26', '0.22']
['陕西', '39528999', '2.8', '2.79']
['甘肃', '25019831', '1.77', '1.91']
['青海', '5923957', '0.42', '0.42']
['宁夏', '7202654', '0.51', '0.47']
['新疆', '25852345', '1.83', '1.63']
2.2 csv读取两种方式
python中,csv模块提供两种方法对文件进行读取;
- 方式1:逐行读取,只有数据,csv_reader = csv.reader(iterable [, dialect=‘excel’],…)
fpath = r"data\china_stastic.csv"
import csv
#打开文件
f = open(fpath, encoding="UTF-8-sig")
#创建csvreader对象
csv_reader = csv.reader(f)
#逐行读取
for line in csv_reader:
    print(line)
#关闭文件
f.close()
['area', 'count', '2020比重', '2010比重']
['全国[5]', '1411778724', '100', '100']
['北京', '21893095', '1.55', '1.46']
['天津', '13866009', '0.98', '0.97']
['河北', '74610235', '5.28', '5.36']
['山西', '34915616', '2.47', '2.67']
['内蒙古', '24049155', '1.7', '1.84']
['辽宁', '42591407', '3.02', '3.27']
['吉林', '24073453', '1.71', '2.05']
['黑龙江', '31850088', '2.26', '2.86']
['上海', '24870895', '1.76', '1.72']
['江苏', '84748016', '6', '5.87']
['浙江', '64567588', '4.57', '4.06']
['安徽', '61027171', '4.32', '4.44']
['福建', '41540086', '2.94', '2.75']
['江西', '45188635', '3.2', '3.33']
['山东', '101527453', '7.19', '7.15']
['河南', '99365519', '7.04', '7.02']
['湖北', '57752557', '4.09', '4.27']
['湖南', '66444864', '4.71', '4.9']
['广东', '126012510', '8.93', '7.79']
['广西', '50126804', '3.55', '3.44']
['海南', '10081232', '0.71', '0.65']
['重庆', '32054159', '2.27', '2.15']
['四川', '83674866', '5.93', '6']
['贵州', '38562148', '2.73', '2.59']
['云南', '47209277', '3.34', '3.43']
['西藏', '3648100', '0.26', '0.22']
['陕西', '39528999', '2.8', '2.79']
['甘肃', '25019831', '1.77', '1.91']
['青海', '5923957', '0.42', '0.42']
['宁夏', '7202654', '0.51', '0.47']
['新疆', '25852345', '1.83', '1.63']
- 方式2:逐行读取,读取内容: 列名+内容,csv_reader = csv. DictReader (iterable [,
dialect=‘excel’],…)
fpath = r"data\china_stastic.csv"
import csv
f = open(fpath, encoding="UTF-8-sig")
#创建DictReader对象
csv_reader = csv.DictReader(f)
for line in csv_reader:
    print(line)
#关闭文件
f.close()
{'area': '全国[5]', 'count': '1411778724', '2020比重': '100', '2010比重': '100'}
{'area': '北京', 'count': '21893095', '2020比重': '1.55', '2010比重': '1.46'}
{'area': '天津', 'count': '13866009', '2020比重': '0.98', '2010比重': '0.97'}
{'area': '河北', 'count': '74610235', '2020比重': '5.28', '2010比重': '5.36'}
{'area': '山西', 'count': '34915616', '2020比重': '2.47', '2010比重': '2.67'}
{'area': '内蒙古', 'count': '24049155', '2020比重': '1.7', '2010比重': '1.84'}
{'area': '辽宁', 'count': '42591407', '2020比重': '3.02', '2010比重': '3.27'}
{'area': '吉林', 'count': '24073453', '2020比重': '1.71', '2010比重': '2.05'}
{'area': '黑龙江', 'count': '31850088', '2020比重': '2.26', '2010比重': '2.86'}
{'area': '上海', 'count': '24870895', '2020比重': '1.76', '2010比重': '1.72'}
{'area': '江苏', 'count': '84748016', '2020比重': '6', '2010比重': '5.87'}
{'area': '浙江', 'count': '64567588', '2020比重': '4.57', '2010比重': '4.06'}
{'area': '安徽', 'count': '61027171', '2020比重': '4.32', '2010比重': '4.44'}
{'area': '福建', 'count': '41540086', '2020比重': '2.94', '2010比重': '2.75'}
{'area': '江西', 'count': '45188635', '2020比重': '3.2', '2010比重': '3.33'}
{'area': '山东', 'count': '101527453', '2020比重': '7.19', '2010比重': '7.15'}
{'area': '河南', 'count': '99365519', '2020比重': '7.04', '2010比重': '7.02'}
{'area': '湖北', 'count': '57752557', '2020比重': '4.09', '2010比重': '4.27'}
{'area': '湖南', 'count': '66444864', '2020比重': '4.71', '2010比重': '4.9'}
{'area': '广东', 'count': '126012510', '2020比重': '8.93', '2010比重': '7.79'}
{'area': '广西', 'count': '50126804', '2020比重': '3.55', '2010比重': '3.44'}
{'area': '海南', 'count': '10081232', '2020比重': '0.71', '2010比重': '0.65'}
{'area': '重庆', 'count': '32054159', '2020比重': '2.27', '2010比重': '2.15'}
{'area': '四川', 'count': '83674866', '2020比重': '5.93', '2010比重': '6'}
{'area': '贵州', 'count': '38562148', '2020比重': '2.73', '2010比重': '2.59'}
{'area': '云南', 'count': '47209277', '2020比重': '3.34', '2010比重': '3.43'}
{'area': '西藏', 'count': '3648100', '2020比重': '0.26', '2010比重': '0.22'}
{'area': '陕西', 'count': '39528999', '2020比重': '2.8', '2010比重': '2.79'}
{'area': '甘肃', 'count': '25019831', '2020比重': '1.77', '2010比重': '1.91'}
{'area': '青海', 'count': '5923957', '2020比重': '0.42', '2010比重': '0.42'}
{'area': '宁夏', 'count': '7202654', '2020比重': '0.51', '2010比重': '0.47'}
{'area': '新疆', 'count': '25852345', '2020比重': '1.83', '2010比重': '1.63'}
fpath = r"data\china_stastic.csv"

def csv_reader(fpath,encoding_type):
    f = open(fpath,encoding=encoding_type)
    #创建DictReader对象
    csv_reader = csv.DictReader(f)
    for line in csv_reader:
        print(line)
    #关闭文件
    f.close()

csv_reader(fpath,"UTF-8-sig")
{'area': '全国[5]', 'count': '1411778724', '2020比重': '100', '2010比重': '100'}
{'area': '北京', 'count': '21893095', '2020比重': '1.55', '2010比重': '1.46'}
{'area': '天津', 'count': '13866009', '2020比重': '0.98', '2010比重': '0.97'}
{'area': '河北', 'count': '74610235', '2020比重': '5.28', '2010比重': '5.36'}
{'area': '山西', 'count': '34915616', '2020比重': '2.47', '2010比重': '2.67'}
{'area': '内蒙古', 'count': '24049155', '2020比重': '1.7', '2010比重': '1.84'}
{'area': '辽宁', 'count': '42591407', '2020比重': '3.02', '2010比重': '3.27'}
{'area': '吉林', 'count': '24073453', '2020比重': '1.71', '2010比重': '2.05'}
{'area': '黑龙江', 'count': '31850088', '2020比重': '2.26', '2010比重': '2.86'}
{'area': '上海', 'count': '24870895', '2020比重': '1.76', '2010比重': '1.72'}
{'area': '江苏', 'count': '84748016', '2020比重': '6', '2010比重': '5.87'}
{'area': '浙江', 'count': '64567588', '2020比重': '4.57', '2010比重': '4.06'}
{'area': '安徽', 'count': '61027171', '2020比重': '4.32', '2010比重': '4.44'}
{'area': '福建', 'count': '41540086', '2020比重': '2.94', '2010比重': '2.75'}
{'area': '江西', 'count': '45188635', '2020比重': '3.2', '2010比重': '3.33'}
{'area': '山东', 'count': '101527453', '2020比重': '7.19', '2010比重': '7.15'}
{'area': '河南', 'count': '99365519', '2020比重': '7.04', '2010比重': '7.02'}
{'area': '湖北', 'count': '57752557', '2020比重': '4.09', '2010比重': '4.27'}
{'area': '湖南', 'count': '66444864', '2020比重': '4.71', '2010比重': '4.9'}
{'area': '广东', 'count': '126012510', '2020比重': '8.93', '2010比重': '7.79'}
{'area': '广西', 'count': '50126804', '2020比重': '3.55', '2010比重': '3.44'}
{'area': '海南', 'count': '10081232', '2020比重': '0.71', '2010比重': '0.65'}
{'area': '重庆', 'count': '32054159', '2020比重': '2.27', '2010比重': '2.15'}
{'area': '四川', 'count': '83674866', '2020比重': '5.93', '2010比重': '6'}
{'area': '贵州', 'count': '38562148', '2020比重': '2.73', '2010比重': '2.59'}
{'area': '云南', 'count': '47209277', '2020比重': '3.34', '2010比重': '3.43'}
{'area': '西藏', 'count': '3648100', '2020比重': '0.26', '2010比重': '0.22'}
{'area': '陕西', 'count': '39528999', '2020比重': '2.8', '2010比重': '2.79'}
{'area': '甘肃', 'count': '25019831', '2020比重': '1.77', '2010比重': '1.91'}
{'area': '青海', 'count': '5923957', '2020比重': '0.42', '2010比重': '0.42'}
{'area': '宁夏', 'count': '7202654', '2020比重': '0.51', '2010比重': '0.47'}
{'area': '新疆', 'count': '25852345', '2020比重': '1.83', '2010比重': '1.63'}
2.3 writer方式写入
主要方法与流程:
#创建writer对象
csvw = csv. writer(iterable [, dialect='excel'],…)
#写入一行
csv.writerow(row)
#写入多行
csv.writerows(rows)
注意:
- 一般写入第一行为字段
- 写入内容的顺序要与字段对应
import csv
fpath = r"data\csv_write_test.csv"
#打开文件
f = open(fpath, "w",encoding = "gb18030")
#创建writer对象
csv_write = csv.writer(f)

cols = ["姓名", "年龄", "身高"]
line = ["奇猫", 20, 175]
lines = [["小张", 21, 178],["小李", 21, 172]]

#写入字段
csv_write.writerow(cols)
#写入第一行数据
csv_write.writerow(line)
#写入多行数据
csv_write.writerows(lines)
#关闭文件
f.close()

csv_reader(fpath,"gb18030")
{'姓名': '奇猫', '年龄': '20', '身高': '175'}
{'姓名': '小张', '年龄': '21', '身高': '178'}
{'姓名': '小李', '年龄': '21', '身高': '172'}
2.4 csv写入空白行问题
造成原因:写入两次换行
解决方式:
方式1.打开文件,open设置newline为空字符串:f = open(fpath, “w”,newline=“”)
方式2.创建write对象,指定lineterminator为"\r":csv_write = csv.writer(f, lineterminator=“\r”)
2.5 DictWriter方式写入
写入流程:
#创建DictWriter对象,fieldnames:字段名称
csvw = csv.DictWriter(f, fieldnames, restval='',...)
#写入字段
wrcsv.writeheader()
#写入一行数据,数据格式为字典
wrcsv.writerow(rowdict)
#写入多行数据
wrcsv.writerow(rowdicts)
import csv
fpath = r"data\csv_dictwrite_test.csv"
#打开文件
f = open(fpath, "w",newline="")

cols = ["姓名", "年龄", "身高"]
#创建writer对象
csv_write = csv.DictWriter(f, fieldnames=cols)
#写入列名
csv_write.writeheader()

#写入数据,将数据整理成字典形式;
line = ["奇猫", 20, 175]
lines = [["小张", 21, 178],["小李", 21, 172]]

#写入第一行数据
item = dict(zip(cols, line))
csv_write.writerow(item)
#写入多行数据
items = [dict(zip(cols, item)) for item in lines]
csv_write.writerows(items)
#关闭文件
f.close()

csv_reader(fpath,"utf-8")
{'姓名': '奇猫', '年龄': '20', '身高': '175'}
{'姓名': '小张', '年龄': '21', '身高': '178'}
{'姓名': '小李', '年龄': '21', '身高': '172'}
3 csv 文件练习
准备工作:russian_demography.csv数据集,数据集内容与字段:
数据集内容:
| 字段 | 说明 |
|---|---|
year |
年份。 |
region |
地区。 |
npg |
增长率。 |
birth_rate |
1000人口出生率。 |
death_rate |
1000人口死亡率。 |
gdw |
人口比重。 |
urbanization |
城市化率。 |
需求:
- 基本数据统计,数据量,年份值及数量,地区及数量;
- 按照年份统计整体的出生率,死亡率,并分别降序;
- 将指定年份将数据保存到指定文件中;
目标:
- 使用Python处理数据;
- csv文件读写强化练习;
- 数据结构灵活使用;
- 提升编程思维与动手能力;
3.1 基本信息统计
问题:
- 数据读取?
- 选择哪种数据结构记录?
import csv
def count_base_info(fpath):
    result = {"lens":0, "years":[], "regions":[]}
    f = open(fpath, encoding='Windows-1252')
    csv_reader = csv.DictReader(f)
    for item in csv_reader:
        result["lens"] += 1
        year = item.get("year")
        region = item.get("region")
        key_map = {"years":"year", "regions":"region"}
        for k1, k2 in key_map.items():
            value = item.get(k2)
            if value and value not in result[k1]:
                result[k1].append(value)
    return result

fpath = r"data\russian_demography.csv"
res = count_base_info(fpath)

#统计总数量
print("数据量:", res["lens"])
#输出年份数量及数值
print("年份数量:", len(res["years"]))
print("所有年份",' '.join(res["years"]))
#输出区域数量及名称
print("区域数量:",len(res["regions"]))
print("区域名称:",",".join(res["regions"]))
数据量: 2380
年份数量: 28
所有年份 1990 1991 1992 1993 1994 1995 1996 1997 1998 1999 2000 2001 2002 2003 2004 2005 2006 2007 2008 2009 2010 2011 2012 2013 2014 2015 2016 2017
区域数量: 85
区域名称: Republic of Adygea,Altai Krai,Amur Oblast,Arkhangelsk Oblast,Astrakhan Oblast,Republic of Bashkortostan,Belgorod Oblast,Bryansk Oblast,Republic of Buryatia,Vladimir Oblast,Volgograd Oblast,Vologda Oblast,Voronezh Oblast,Republic of Dagestan,Jewish Autonomous Oblast,Zabaykalsky Krai,Ivanovo Oblast,Republic of Ingushetia,Irkutsk Oblast,Kabardino-Balkar Republic,Kaliningrad Oblast,Republic of Kalmykia,Kaluga Oblast,Kamchatka Krai,Karachay-Cherkess Republic,Republic of Karelia,Kemerovo Oblast,Kirov Oblast,Kostroma Oblast,Krasnodar Krai,Krasnoyarsk Krai,Republic of Crimea,Kurgan Oblast,Kursk Oblast,Leningrad Oblast,Lipetsk Oblast,Magadan Oblast,Mari El Republic,Republic of Mordovia,Moscow,Moscow Oblast,Murmansk Oblast,Nenets Autonomous Okrug,Nizhny Novgorod Oblast,Novgorod Oblast,Novosibirsk Oblast,Omsk Oblast,Orenburg Oblast,Oryol Oblast,Penza Oblast,Perm Krai,Primorsky Krai,Pskov Oblast,Altai Republic,Komi Republic,Tuva Republic,Rostov Oblast,Ryazan Oblast,Samara Oblast,Saint Petersburg,Saratov Oblast,Sakhalin Oblast,Sverdlovsk Oblast,Sevastopol,Republic of North Ossetia-Alania,Smolensk Oblast,Stavropol Krai,Tambov Oblast,Republic of Tatarstan,Tver Oblast,Tomsk Oblast,Tula Oblast,Tyumen Oblast,Udmurt Republic,Ulyanovsk Oblast,Khabarovsk Krai,Republic of Khakassia,Khanty–Mansi Autonomous Okrug â€?Yugra,Chelyabinsk Oblast,Chechen Republic,Chuvash Republic,Chukotka Autonomous Okrug,Sakha (Yakutia) Republic,Yamalo-Nenets Autonomous Okrug,Yaroslavl Oblast
3.2 按照年份统计出生率与死亡率
问题:
- 数据结构定义?
- 实现过程与思路?
数据结构:
#记录每年的累积出生率,死亡率,数量,最后统计计算平均出生率,死亡率;
{
年份:{year:年份,birth_rate:累加值,death_rate:累加值,counts:出现次数},
年份:{year:年份,birth_rate:累加值,death_rate:累加值,counts:出现次数},
...
}
基本数据统计完成之后,分别计算每个年份对应的出生率,死亡率
import csv

def str_to_float(value):
    #将字符串装成浮点数
    if value.strip():
        return float(value.strip())
    else:
        return 0

def count_rate(fpath):
    #数据基本统计
    result = {}
    f = open(fpath, encoding='Windows-1252')
    csv_reader = csv.DictReader(f)

    for item in csv_reader:
        #获取年份,出生率,死亡率
        year = item.get("year")
        birth_rate = str_to_float(item.get("birth_rate"))
        death_rate = str_to_float(item.get("death_rate"))
        #根据年份统计数据
        if year in result:
            tmp = result[year]
            tmp["birth_rate"] += birth_rate
            tmp["birth_rate"] = round(tmp["birth_rate"],2)
            tmp["death_rate"] += death_rate
            tmp["death_rate"] = round(tmp["death_rate"],2)
            tmp["nums"] += 1
        else:
            tmp = {"year":year,"birth_rate":birth_rate,"death_rate":death_rate,
        "nums":1}
        result[year]= tmp
    #统计每个年份的平均出生率与死亡率
    res = []
    for key in result:
        values = result[key]
        tmp = {"year":key}
        tmp["average_birth_rate"] = round(values["birth_rate"]/values["nums"],2)
        tmp["average_death_rate"] = round(values["death_rate"]/values["nums"],2)
        res.append(tmp)
    return res

def dump(items):
    for item in items:
        print(item)

#获取出生率
def sort_by_birth_rate(item):
    return item.get("average_birth_rate")

#获取死亡率
def sort_by_death_rate(item):
    return item.get("average_death_rate")

fpath = r"data\russian_demography.csv"

res = count_rate(fpath)

res.sort(key=sort_by_birth_rate, reverse=True)
dump(res)

res.sort(key=sort_by_death_rate, reverse=True)
dump(res)
{'year': '1990', 'average_birth_rate': 13.85, 'average_death_rate': 10.17}
{'year': '2014', 'average_birth_rate': 13.69, 'average_death_rate': 12.82}
{'year': '2015', 'average_birth_rate': 13.52, 'average_death_rate': 13.13}
{'year': '2012', 'average_birth_rate': 13.5, 'average_death_rate': 13.05}
{'year': '2013', 'average_birth_rate': 13.35, 'average_death_rate': 12.82}
{'year': '2016', 'average_birth_rate': 13.04, 'average_death_rate': 12.96}
{'year': '2011', 'average_birth_rate': 12.92, 'average_death_rate': 13.21}
{'year': '2010', 'average_birth_rate': 12.89, 'average_death_rate': 13.92}
{'year': '2009', 'average_birth_rate': 12.65, 'average_death_rate': 13.83}
{'year': '1991', 'average_birth_rate': 12.51, 'average_death_rate': 10.4}
{'year': '2008', 'average_birth_rate': 12.42, 'average_death_rate': 14.19}
{'year': '2007', 'average_birth_rate': 11.77, 'average_death_rate': 14.15}
{'year': '2017', 'average_birth_rate': 11.65, 'average_death_rate': 12.5}
{'year': '1992', 'average_birth_rate': 11.07, 'average_death_rate': 11.18}
{'year': '2004', 'average_birth_rate': 10.84, 'average_death_rate': 15.49}
{'year': '2006', 'average_birth_rate': 10.72, 'average_death_rate': 14.76}
{'year': '2003', 'average_birth_rate': 10.64, 'average_death_rate': 15.86}
{'year': '2005', 'average_birth_rate': 10.56, 'average_death_rate': 15.7}
{'year': '2002', 'average_birth_rate': 9.95, 'average_death_rate': 15.43}
{'year': '1994', 'average_birth_rate': 9.75, 'average_death_rate': 14.3}
{'year': '1995', 'average_birth_rate': 9.67, 'average_death_rate': 13.84}
{'year': '1993', 'average_birth_rate': 9.57, 'average_death_rate': 13.18}
{'year': '2001', 'average_birth_rate': 9.35, 'average_death_rate': 14.76}
{'year': '1996', 'average_birth_rate': 9.22, 'average_death_rate': 13.25}
{'year': '1998', 'average_birth_rate': 9.15, 'average_death_rate': 12.69}
{'year': '2000', 'average_birth_rate': 8.99, 'average_death_rate': 14.4}
{'year': '1997', 'average_birth_rate': 8.91, 'average_death_rate': 12.84}
{'year': '1999', 'average_birth_rate': 8.65, 'average_death_rate': 13.78}
{'year': '2003', 'average_birth_rate': 10.64, 'average_death_rate': 15.86}
{'year': '2005', 'average_birth_rate': 10.56, 'average_death_rate': 15.7}
{'year': '2004', 'average_birth_rate': 10.84, 'average_death_rate': 15.49}
{'year': '2002', 'average_birth_rate': 9.95, 'average_death_rate': 15.43}
{'year': '2006', 'average_birth_rate': 10.72, 'average_death_rate': 14.76}
{'year': '2001', 'average_birth_rate': 9.35, 'average_death_rate': 14.76}
{'year': '2000', 'average_birth_rate': 8.99, 'average_death_rate': 14.4}
{'year': '1994', 'average_birth_rate': 9.75, 'average_death_rate': 14.3}
{'year': '2008', 'average_birth_rate': 12.42, 'average_death_rate': 14.19}
{'year': '2007', 'average_birth_rate': 11.77, 'average_death_rate': 14.15}
{'year': '2010', 'average_birth_rate': 12.89, 'average_death_rate': 13.92}
{'year': '1995', 'average_birth_rate': 9.67, 'average_death_rate': 13.84}
{'year': '2009', 'average_birth_rate': 12.65, 'average_death_rate': 13.83}
{'year': '1999', 'average_birth_rate': 8.65, 'average_death_rate': 13.78}
{'year': '1996', 'average_birth_rate': 9.22, 'average_death_rate': 13.25}
{'year': '2011', 'average_birth_rate': 12.92, 'average_death_rate': 13.21}
{'year': '1993', 'average_birth_rate': 9.57, 'average_death_rate': 13.18}
{'year': '2015', 'average_birth_rate': 13.52, 'average_death_rate': 13.13}
{'year': '2012', 'average_birth_rate': 13.5, 'average_death_rate': 13.05}
{'year': '2016', 'average_birth_rate': 13.04, 'average_death_rate': 12.96}
{'year': '1997', 'average_birth_rate': 8.91, 'average_death_rate': 12.84}
{'year': '2014', 'average_birth_rate': 13.69, 'average_death_rate': 12.82}
{'year': '2013', 'average_birth_rate': 13.35, 'average_death_rate': 12.82}
{'year': '1998', 'average_birth_rate': 9.15, 'average_death_rate': 12.69}
{'year': '2017', 'average_birth_rate': 11.65, 'average_death_rate': 12.5}
{'year': '1992', 'average_birth_rate': 11.07, 'average_death_rate': 11.18}
{'year': '1991', 'average_birth_rate': 12.51, 'average_death_rate': 10.4}
{'year': '1990', 'average_birth_rate': 13.85, 'average_death_rate': 10.17}
3.3 将指定年份保存
思路与流程:
- 打开csv文件遍历数据
- 过滤指定年份数据
- 保存数据到指定的csv文件
def filer_data(infpath, outfpath, year):
    result = {}
    rows = []
    fr = open(infpath, encoding='Windows-1252')
    csv_reader = csv.DictReader(fr)
    for item in csv_reader:
        #按年份过滤
        if year == item.get("year"):
            rows.append(item)
    fr.close()

    #打开文件
    fw = open(outfpath, "w",newline="", encoding='utf-8')
    #获取列名
    cols = item.keys()
    #创建DictWriter对象
    csv_writer = csv.DictWriter(fw, fieldnames=cols)
    #写入字段
    csv_writer.writeheader()
    #写入数据
    csv_writer.writerows(rows)
    #关闭文件
    fw.close()

def read_csv(fpath):
    f = open(fpath, encoding="UTF-8-sig")
    #创建DictReader对象
    csv_reader = csv.DictReader(f)
    for line in csv_reader:
        print(line)
    #关闭文件
    f.close()

year = "2007"
infpath = r"data\russian_demography.csv"
outfpath = r"data\2017_data.csv"
filer_data(infpath, outfpath, year)
read_csv(outfpath)
{'year': '2007', 'region': 'Republic of Adygea', 'npg': '-2.8', 'birth_rate': '11.8', 'death_rate': '14.7', 'gdw': '67.18', 'urbanization': '51.1'}
{'year': '2007', 'region': 'Altai Krai', 'npg': '-3.6', 'birth_rate': '11.3', 'death_rate': '15.2', 'gdw': '58.3', 'urbanization': '54.2'}
{'year': '2007', 'region': 'Amur Oblast', 'npg': '-1.7', 'birth_rate': '12.6', 'death_rate': '14.7', 'gdw': '54.69', 'urbanization': '66.6'}
{'year': '2007', 'region': 'Arkhangelsk Oblast', 'npg': '-2.8', 'birth_rate': '11.9', 'death_rate': '14.9', 'gdw': '55.67', 'urbanization': '74.4'}
{'year': '2007', 'region': 'Astrakhan Oblast', 'npg': '-0.6', 'birth_rate': '13.5', 'death_rate': '14', 'gdw': '59.64', 'urbanization': '66.9'}
{'year': '2007', 'region': 'Republic of Bashkortostan', 'npg': '-0.9', 'birth_rate': '12.7', 'death_rate': '13.6', 'gdw': '59.5', 'urbanization': '59.8'}
{'year': '2007', 'region': 'Belgorod Oblast', 'npg': '-4.5', 'birth_rate': '10.3', 'death_rate': '14.8', 'gdw': '61.77', 'urbanization': '65.8'}
{'year': '2007', 'region': 'Bryansk Oblast', 'npg': '-7.6', 'birth_rate': '10.2', 'death_rate': '17.9', 'gdw': '63.3', 'urbanization': '68.6'}
{'year': '2007', 'region': 'Republic of Buryatia', 'npg': '2.8', 'birth_rate': '16.1', 'death_rate': '13.3', 'gdw': '54.77', 'urbanization': '56'}
{'year': '2007', 'region': 'Vladimir Oblast', 'npg': '-8.5', 'birth_rate': '10.2', 'death_rate': '18.5', 'gdw': '62.98', 'urbanization': '77.3'}
{'year': '2007', 'region': 'Volgograd Oblast', 'npg': '-3.9', 'birth_rate': '10.7', 'death_rate': '14.6', 'gdw': '61.97', 'urbanization': '75.4'}
{'year': '2007', 'region': 'Vologda Oblast', 'npg': '-4.3', 'birth_rate': '11.6', 'death_rate': '16', 'gdw': '58.5', 'urbanization': '69'}
{'year': '2007', 'region': 'Voronezh Oblast', 'npg': '-8.7', 'birth_rate': '9', 'death_rate': '17.3', 'gdw': '64.71', 'urbanization': '61.7'}
{'year': '2007', 'region': 'Republic of Dagestan', 'npg': '11.3', 'birth_rate': '17', 'death_rate': '5.6', 'gdw': '62.7', 'urbanization': '44.2'}
{'year': '2007', 'region': 'Jewish Autonomous Oblast', 'npg': '-2.1', 'birth_rate': '13', 'death_rate': '15.6', 'gdw': '54.92', 'urbanization': '67.2'}
{'year': '2007', 'region': 'Zabaykalsky Krai', 'npg': '0.5', 'birth_rate': '14.9', 'death_rate': '14.5', 'gdw': '56.07', 'urbanization': '64.6'}
{'year': '2007', 'region': 'Ivanovo Oblast', 'npg': '-9', 'birth_rate': '9.8', 'death_rate': '18.8', 'gdw': '64.17', 'urbanization': '80.6'}
{'year': '2007', 'region': 'Republic of Ingushetia', 'npg': '13.4', 'birth_rate': '16.7', 'death_rate': '4', 'gdw': '66.38', 'urbanization': '42.6'}
{'year': '2007', 'region': 'Irkutsk Oblast', 'npg': '-0.2', 'birth_rate': '13.8', 'death_rate': '14.3', 'gdw': '57.27', 'urbanization': '79.4'}
{'year': '2007', 'region': 'Kabardino-Balkar Republic', 'npg': '3.3', 'birth_rate': '12.8', 'death_rate': '9.8', 'gdw': '58.24', 'urbanization': '57.5'}
{'year': '2007', 'region': 'Kaliningrad Oblast', 'npg': '-4.5', 'birth_rate': '10.9', 'death_rate': '15.4', 'gdw': '55.87', 'urbanization': '77.3'}
{'year': '2007', 'region': 'Republic of Kalmykia', 'npg': '3.5', 'birth_rate': '14.5', 'death_rate': '10.7', 'gdw': '54.32', 'urbanization': '43.8'}
{'year': '2007', 'region': 'Kaluga Oblast', 'npg': '-7.3', 'birth_rate': '10', 'death_rate': '17.1', 'gdw': '61.15', 'urbanization': '75.2'}
{'year': '2007', 'region': 'Kamchatka Krai', 'npg': '0.1', 'birth_rate': '11.3', 'death_rate': '11.7', 'gdw': '46.65', 'urbanization': '79'}
{'year': '2007', 'region': 'Karachay-Cherkess Republic', 'npg': '3.4', 'birth_rate': '14.2', 'death_rate': '10', 'gdw': '59.82', 'urbanization': '44.2'}
{'year': '2007', 'region': 'Republic of Karelia', 'npg': '-5.3', 'birth_rate': '10.6', 'death_rate': '16.6', 'gdw': '56.09', 'urbanization': '76.6'}
{'year': '2007', 'region': 'Kemerovo Oblast', 'npg': '-4.5', 'birth_rate': '12.1', 'death_rate': '16.8', 'gdw': '57.5', 'urbanization': '85.2'}
{'year': '2007', 'region': 'Kirov Oblast', 'npg': '-6.2', 'birth_rate': '10.6', 'death_rate': '17.2', 'gdw': '58.72', 'urbanization': '72.6'}
{'year': '2007', 'region': 'Kostroma Oblast', 'npg': '-7.1', 'birth_rate': '10.7', 'death_rate': '18.1', 'gdw': '61.75', 'urbanization': '69.1'}
{'year': '2007', 'region': 'Krasnodar Krai', 'npg': '-3.1', 'birth_rate': '11.3', 'death_rate': '14.3', 'gdw': '64.38', 'urbanization': '52.8'}
{'year': '2007', 'region': 'Krasnoyarsk Krai', 'npg': '-1.5', 'birth_rate': '11.8', 'death_rate': '13.5', 'gdw': '54.11', 'urbanization': '75.5'}
{'year': '2007', 'region': 'Republic of Crimea', 'npg': '', 'birth_rate': '', 'death_rate': '', 'gdw': '', 'urbanization': ''}
{'year': '2007', 'region': 'Kurgan Oblast', 'npg': '-4.3', 'birth_rate': '11.6', 'death_rate': '16.3', 'gdw': '63.08', 'urbanization': '58.9'}
{'year': '2007', 'region': 'Kursk Oblast', 'npg': '-7.9', 'birth_rate': '10.1', 'death_rate': '18.2', 'gdw': '64.7', 'urbanization': '63.1'}
{'year': '2007', 'region': 'Leningrad Oblast', 'npg': '-9.9', 'birth_rate': '8.3', 'death_rate': '17.6', 'gdw': '59.1', 'urbanization': '65.9'}
{'year': '2007', 'region': 'Lipetsk Oblast', 'npg': '-6.8', 'birth_rate': '10.2', 'death_rate': '16.8', 'gdw': '62.81', 'urbanization': '63.2'}
{'year': '2007', 'region': 'Magadan Oblast', 'npg': '-2.3', 'birth_rate': '10.9', 'death_rate': '13.3', 'gdw': '42.65', 'urbanization': '94.4'}
{'year': '2007', 'region': 'Mari El Republic', 'npg': '-3.4', 'birth_rate': '11.8', 'death_rate': '15.2', 'gdw': '54.48', 'urbanization': '62.7'}
{'year': '2007', 'region': 'Republic of Mordovia', 'npg': '-6.6', 'birth_rate': '9.2', 'death_rate': '15.6', 'gdw': '57.96', 'urbanization': '58.9'}
{'year': '2007', 'region': 'Moscow', 'npg': '-2.2', 'birth_rate': '9.7', 'death_rate': '11.1', 'gdw': '53.53', 'urbanization': '100'}
{'year': '2007', 'region': 'Moscow Oblast', 'npg': '-7', 'birth_rate': '9.6', 'death_rate': '16.1', 'gdw': '58.77', 'urbanization': '80.3'}
{'year': '2007', 'region': 'Murmansk Oblast', 'npg': '-1.4', 'birth_rate': '10.3', 'death_rate': '12.2', 'gdw': '46.53', 'urbanization': '92.5'}
{'year': '2007', 'region': 'Nenets Autonomous Okrug', 'npg': '3', 'birth_rate': '15.6', 'death_rate': '12.6', 'gdw': '51.74', 'urbanization': '66'}
{'year': '2007', 'region': 'Nizhny Novgorod Oblast', 'npg': '-8.4', 'birth_rate': '9.9', 'death_rate': '18.3', 'gdw': '62.04', 'urbanization': '78.4'}
{'year': '2007', 'region': 'Novgorod Oblast', 'npg': '-9.4', 'birth_rate': '10.7', 'death_rate': '20.1', 'gdw': '63.91', 'urbanization': '71.2'}
{'year': '2007', 'region': 'Novosibirsk Oblast', 'npg': '-3.3', 'birth_rate': '11.4', 'death_rate': '14.7', 'gdw': '56.63', 'urbanization': '76.1'}
{'year': '2007', 'region': 'Omsk Oblast', 'npg': '-2.9', 'birth_rate': '11.7', 'death_rate': '14.8', 'gdw': '56.11', 'urbanization': '70.8'}
{'year': '2007', 'region': 'Orenburg Oblast', 'npg': '-2.5', 'birth_rate': '12.1', 'death_rate': '15', 'gdw': '59.25', 'urbanization': '58.9'}
{'year': '2007', 'region': 'Oryol Oblast', 'npg': '-7.9', 'birth_rate': '9.6', 'death_rate': '17.8', 'gdw': '64.13', 'urbanization': '65'}
{'year': '2007', 'region': 'Penza Oblast', 'npg': '-6.4', 'birth_rate': '9.7', 'death_rate': '15.9', 'gdw': '62.31', 'urbanization': '66.1'}
{'year': '2007', 'region': 'Perm Krai', 'npg': '-3.6', 'birth_rate': '12.1', 'death_rate': '15.9', 'gdw': '58.31', 'urbanization': '75.4'}
{'year': '2007', 'region': 'Primorsky Krai', 'npg': '-3.4', 'birth_rate': '11.2', 'death_rate': '14.7', 'gdw': '54.29', 'urbanization': '75.8'}
{'year': '2007', 'region': 'Pskov Oblast', 'npg': '-11.2', 'birth_rate': '9.7', 'death_rate': '21', 'gdw': '64.59', 'urbanization': '68.8'}
{'year': '2007', 'region': 'Altai Republic', 'npg': '7.2', 'birth_rate': '19.7', 'death_rate': '12.7', 'gdw': '58.55', 'urbanization': '26.7'}
{'year': '2007', 'region': 'Komi Republic', 'npg': '-0.8', 'birth_rate': '11.9', 'death_rate': '13.1', 'gdw': '48.59', 'urbanization': '76'}
{'year': '2007', 'region': 'Tuva Republic', 'npg': '12.5', 'birth_rate': '24.4', 'death_rate': '12.2', 'gdw': '61.88', 'urbanization': '51.9'}
{'year': '2007', 'region': 'Rostov Oblast', 'npg': '-4.8', 'birth_rate': '10.2', 'death_rate': '14.8', 'gdw': '61.9', 'urbanization': '66.8'}
{'year': '2007', 'region': 'Ryazan Oblast', 'npg': '-9.6', 'birth_rate': '9.4', 'death_rate': '18.9', 'gdw': '66.21', 'urbanization': '70.4'}
{'year': '2007', 'region': 'Samara Oblast', 'npg': '-4.6', 'birth_rate': '10.7', 'death_rate': '15.1', 'gdw': '58.54', 'urbanization': '80.1'}
{'year': '2007', 'region': 'Saint Petersburg', 'npg': '-5.3', 'birth_rate': '9.5', 'death_rate': '14.2', 'gdw': '57.71', 'urbanization': '100'}
{'year': '2007', 'region': 'Saratov Oblast', 'npg': '-5.1', 'birth_rate': '10.2', 'death_rate': '15.5', 'gdw': '61.88', 'urbanization': '74'}
{'year': '2007', 'region': 'Sakhalin Oblast', 'npg': '-2.4', 'birth_rate': '11.8', 'death_rate': '14.4', 'gdw': '49.19', 'urbanization': '78.8'}
{'year': '2007', 'region': 'Sverdlovsk Oblast', 'npg': '-3.2', 'birth_rate': '11.5', 'death_rate': '14.9', 'gdw': '58.09', 'urbanization': '83.4'}
{'year': '2007', 'region': 'Sevastopol', 'npg': '', 'birth_rate': '', 'death_rate': '', 'gdw': '', 'urbanization': ''}
{'year': '2007', 'region': 'Republic of North Ossetia-Alania', 'npg': '2.5', 'birth_rate': '13.6', 'death_rate': '11', 'gdw': '65.95', 'urbanization': '64.1'}
{'year': '2007', 'region': 'Smolensk Oblast', 'npg': '-10', 'birth_rate': '9.6', 'death_rate': '19.1', 'gdw': '59.1', 'urbanization': '71.8'}
{'year': '2007', 'region': 'Stavropol Krai', 'npg': '-2.1', 'birth_rate': '11.3', 'death_rate': '13.1', 'gdw': '62.5', 'urbanization': '56.6'}
{'year': '2007', 'region': 'Tambov Oblast', 'npg': '-8.7', 'birth_rate': '8.9', 'death_rate': '17.4', 'gdw': '65.39', 'urbanization': '58.1'}
{'year': '2007', 'region': 'Republic of Tatarstan', 'npg': '-2.1', 'birth_rate': '10.9', 'death_rate': '13', 'gdw': '59.22', 'urbanization': '74.7'}
{'year': '2007', 'region': 'Tver Oblast', 'npg': '-10.4', 'birth_rate': '10.2', 'death_rate': '20.5', 'gdw': '66.06', 'urbanization': '73.6'}
{'year': '2007', 'region': 'Tomsk Oblast', 'npg': '-0.8', 'birth_rate': '12', 'death_rate': '12.9', 'gdw': '53.19', 'urbanization': '69'}
{'year': '2007', 'region': 'Tula Oblast', 'npg': '-12', 'birth_rate': '8.4', 'death_rate': '20.1', 'gdw': '65.73', 'urbanization': '79.8'}
{'year': '2007', 'region': 'Tyumen Oblast', 'npg': '5.3', 'birth_rate': '14.3', 'death_rate': '9.1', 'gdw': '53.62', 'urbanization': '63.1'}
{'year': '2007', 'region': 'Udmurt Republic', 'npg': '-1.4', 'birth_rate': '12.8', 'death_rate': '14.1', 'gdw': '55.4', 'urbanization': '70.3'}
{'year': '2007', 'region': 'Ulyanovsk Oblast', 'npg': '-6.5', 'birth_rate': '9.3', 'death_rate': '15.7', 'gdw': '58.71', 'urbanization': '73.2'}
{'year': '2007', 'region': 'Khabarovsk Krai', 'npg': '-2.6', 'birth_rate': '11.6', 'death_rate': '14.7', 'gdw': '52.85', 'urbanization': '81.6'}
{'year': '2007', 'region': 'Republic of Khakassia', 'npg': '0.2', 'birth_rate': '13.8', 'death_rate': '13.8', 'gdw': '55.81', 'urbanization': '70.7'}
{'year': '2007', 'region': 'Khanty–Mansi Autonomous Okrug �Yugra', 'npg': '7.9', 'birth_rate': '14.6', 'death_rate': '6.8', 'gdw': '39.3', 'urbanization': '91'}
{'year': '2007', 'region': 'Chelyabinsk Oblast', 'npg': '-3.1', 'birth_rate': '11.8', 'death_rate': '15', 'gdw': '59.62', 'urbanization': '81.8'}
{'year': '2007', 'region': 'Chechen Republic', 'npg': '22.4', 'birth_rate': '27.1', 'death_rate': '4.8', 'gdw': '69.75', 'urbanization': '35'}
{'year': '2007', 'region': 'Chuvash Republic', 'npg': '-2.9', 'birth_rate': '11.6', 'death_rate': '14.7', 'gdw': '58.16', 'urbanization': '57.2'}
{'year': '2007', 'region': 'Chukotka Autonomous Okrug', 'npg': '4.1', 'birth_rate': '15.9', 'death_rate': '11.3', 'gdw': '40.73', 'urbanization': '65'}
{'year': '2007', 'region': 'Sakha (Yakutia) Republic', 'npg': '6.4', 'birth_rate': '16.1', 'death_rate': '9.6', 'gdw': '52.77', 'urbanization': '63.7'}
{'year': '2007', 'region': 'Yamalo-Nenets Autonomous Okrug', 'npg': '8.8', 'birth_rate': '14.2', 'death_rate': '5.6', 'gdw': '37.5', 'urbanization': '84.8'}
{'year': '2007', 'region': 'Yaroslavl Oblast', 'npg': '-7.6', 'birth_rate': '9.9', 'death_rate': '17.8', 'gdw': '63.55', 'urbanization': '81.7'}
(三)时间处理
1 时间处理
-
应用场景:
- 根据时间筛选数据,例如:1个月数据,1年数据,某天数据;
- 与时间相关指标统计:日活,月活,留存等;
-
常见操作:
- 获取当前时间与时间戳;
- 时间转换,例如:时间字符串转成时间对象;
- 时间差计算,例如:最近三天,最近7天,两个时间差;
2 time模块
2.1 时间戳(timestamp)
相关方法:
| 方法 | 说明 |
|---|---|
time.time() |
返回当前时间戳,类型:浮点数。 |
time.time_ns() |
返回纳秒,类型:整数。 |
import time

time.time(),time.time_ns()
(1706702186.493852, 1706702186493851900)
2.2 struct_time
- struct_time形式
字段说明:time.struct_time( tm_year=2022, tm_mon=1, tm_mday=1, tm_hour=1, tm_min=26, tm_sec=57, tm_wday=4, tm_yday=21, tm_isdst=0)tm_year:年 tm_mon:月 tm_mday:日 tm_hour:时 tm_min:分 tm_sec:秒 tm_wday:星期(0-6,周日为0) tm_yday:今年第几天 tm_isdst:是否夏令时 - struct_time相关方法
| 方法 | 说明 |
|---|---|
time.localtime([secs]) |
将时间戳转成 struct_time 类型,如果 secs 为空,获取当前本地时间。 |
time.gmtime([secs]) |
将时间戳转换为UTC时区(0时区)的 struct_time,如果 secs 为空,获取当前UTC时间。 |
st_beijing = time.localtime()
st_utc0 = time.gmtime()
print(st_beijing)
print(st_utc0)
time.struct_time(tm_year=2024, tm_mon=1, tm_mday=31, tm_hour=19, tm_min=56, tm_sec=26, tm_wday=2, tm_yday=31, tm_isdst=0)
time.struct_time(tm_year=2024, tm_mon=1, tm_mday=31, tm_hour=11, tm_min=56, tm_sec=26, tm_wday=2, tm_yday=31, tm_isdst=0)
2.3 时间戳与struct_time转化
方法
| 方法 | 说明 |
|---|---|
time.localtime(ts) |
将时间戳转成 struct_time。 |
time.mktime(tuple) |
将 struct_time 转成时间戳。 |
ts1 = time.time()
print(ts1)
st = time.localtime(ts1)
print(st)
ts2 = time.mktime(st)
print(ts2)
1706702186.5074387
time.struct_time(tm_year=2024, tm_mon=1, tm_mday=31, tm_hour=19, tm_min=56, tm_sec=26, tm_wday=2, tm_yday=31, tm_isdst=0)
1706702186.0
2.4 字符串时间与struct_time转化
方法:
| 方法 | 说明 |
|---|---|
time.strptime(string, format) |
将字符串按照对应的格式转成 struct_time 对象。 |
time.strftime(format[, tuple]) |
将 struct_time 对象按照指定格式转成字符串时间。 |
time.asctime([tuple]) |
将 struct_time 对象转成可读的时间字符串,例如:‘Fri Jan 21 18:06:51 2022’。 |
time.ctime(seconds) |
将时间戳转成可读的时间字符串,例如:‘Fri Jan 21 18:06:51 2022’。 |
format格式:
| 格式 | 说明 |
|---|---|
%Y |
年份[xxxx] |
%y |
年份[xx] |
%m |
月份[01,12] |
%d |
日期[01,31] |
%H |
小时[00,23] |
%I |
小时[00,12] |
%S |
秒数[00,59] |
%p |
AM或PM |
%x |
日期(月/日/不带世纪的年份) |
%X |
时间(时:分:秒) |
%A |
本地完整星期名称 |
%a |
本地简化星期名称 |
%B |
本地完整的月份名称 |
%b |
本地简化的月份名称 |
%w |
星期(0-6),0:周日,1:周1,以此类推 |
练习:
- 获取当前时间戳,并将转成strct_time;
- 获取当前的struct_time,并转成时间戳;
- 将时间戳转成时间字符串,格式:“yyyy-mm-dd hh:mm:ss”;
- 将时间字符串转成时间戳;
# 获取当前时间戳,并将其转成 struct_time
current_timestamp = time.time()
current_struct_time = time.localtime(current_timestamp)

print("当前时间戳:", current_timestamp)
print("转换:", current_struct_time)
当前时间戳: 1706702186.5134797
转换: time.struct_time(tm_year=2024, tm_mon=1, tm_mday=31, tm_hour=19, tm_min=56, tm_sec=26, tm_wday=2, tm_yday=31, tm_isdst=0)
# 获取当前的 struct_time,并转成时间戳
current_struct_time = time.localtime()
current_timestamp = time.mktime(current_struct_time)

print("当前 struct_time:", current_struct_time)
print("转成时间戳:", current_timestamp)
当前 struct_time: time.struct_time(tm_year=2024, tm_mon=1, tm_mday=31, tm_hour=19, tm_min=56, tm_sec=26, tm_wday=2, tm_yday=31, tm_isdst=0)
转成时间戳: 1706702186.0
# 将时间戳转成时间字符串,格式:“yyyy-mm-dd hh:mm:ss”
formatted_time = time.strftime("%Y-%m-%d %H:%M:%S", current_struct_time)

print("时间戳转成时间字符串:", formatted_time)
时间戳转成时间字符串: 2024-01-31 19:56:26
# 将时间字符串转成时间戳
parsed_time = time.strptime(formatted_time, "%Y-%m-%d %H:%M:%S")
parsed_timestamp = time.mktime(parsed_time)

print("时间字符串转成时间戳:", parsed_timestamp)
时间字符串转成时间戳: 1706702186.0
3 datetime模块
| 类 | 说明 |
|---|---|
datetime.date |
表示日期,常用的属性有:year, month 和 day。 |
datetime.time |
表示时间,常用属性有:hour, minute, second, microsecond。 |
datetime.datetime |
表示日期时间。 |
datetime.timedelta |
表示两个 date、time、datetime 实例之间的时间间隔,分辨率(最小单位)可达到微秒。 |
datetime.timezone |
时区相关类。 |
from datetime import date, time, datetime
#创建date对象
date_obj = date(2022, 1, 10)
#创建time对象
time_obj = time(12, 30,1)
#获取当前的时间
dt_now = datetime.now()
print(dt_now)
#获取当前时间戳
print(dt_now.timestamp())
#获取当前时间的date
print(dt_now.date())
#获取当前的time
print(dt_now.time())
#计算时间差
dt_delta = dt_now - datetime(2022, 1,23)
print(dt_delta)
#转成时间字符串
s = dt_now.strftime("%Y-%m-%d %H:%M:%S")
print(s)
#将时间字符串转datetime对象
print(datetime.strptime(s, "%Y-%m-%d %H:%M:%S"))
2024-01-31 19:56:26.538378
1706702186.538378
2024-01-31
19:56:26.538378
738 days, 19:56:26.538378
2024-01-31 19:56:26
2024-01-31 19:56:26
4 calendar模块
calendar,是与日历相关的模块,主要使用:
import calendar
#获取某一年日历,第一行为年份,第二行月份,第三行为星期
import calendar
print(calendar.calendar(2022))
#判断是否是闰年
calendar.isleap(2018)
#获取指定年月的日历
print(calendar.month(2022,1))
#计算指定年月日是星期几
calendar.weekday(2022,1,1)
                                  2022

      January                   February                   March
Mo Tu We Th Fr Sa Su      Mo Tu We Th Fr Sa Su      Mo Tu We Th Fr Sa Su
                1  2          1  2  3  4  5  6          1  2  3  4  5  6
 3  4  5  6  7  8  9       7  8  9 10 11 12 13       7  8  9 10 11 12 13
10 11 12 13 14 15 16      14 15 16 17 18 19 20      14 15 16 17 18 19 20
17 18 19 20 21 22 23      21 22 23 24 25 26 27      21 22 23 24 25 26 27
24 25 26 27 28 29 30      28                        28 29 30 31
31

       April                      May                       June
Mo Tu We Th Fr Sa Su      Mo Tu We Th Fr Sa Su      Mo Tu We Th Fr Sa Su
             1  2  3                         1             1  2  3  4  5
 4  5  6  7  8  9 10       2  3  4  5  6  7  8       6  7  8  9 10 11 12
11 12 13 14 15 16 17       9 10 11 12 13 14 15      13 14 15 16 17 18 19
18 19 20 21 22 23 24      16 17 18 19 20 21 22      20 21 22 23 24 25 26
25 26 27 28 29 30         23 24 25 26 27 28 29      27 28 29 30
                          30 31

        July                     August                  September
Mo Tu We Th Fr Sa Su      Mo Tu We Th Fr Sa Su      Mo Tu We Th Fr Sa Su
             1  2  3       1  2  3  4  5  6  7                1  2  3  4
 4  5  6  7  8  9 10       8  9 10 11 12 13 14       5  6  7  8  9 10 11
11 12 13 14 15 16 17      15 16 17 18 19 20 21      12 13 14 15 16 17 18
18 19 20 21 22 23 24      22 23 24 25 26 27 28      19 20 21 22 23 24 25
25 26 27 28 29 30 31      29 30 31                  26 27 28 29 30

      October                   November                  December
Mo Tu We Th Fr Sa Su      Mo Tu We Th Fr Sa Su      Mo Tu We Th Fr Sa Su
                1  2          1  2  3  4  5  6                1  2  3  4
 3  4  5  6  7  8  9       7  8  9 10 11 12 13       5  6  7  8  9 10 11
10 11 12 13 14 15 16      14 15 16 17 18 19 20      12 13 14 15 16 17 18
17 18 19 20 21 22 23      21 22 23 24 25 26 27      19 20 21 22 23 24 25
24 25 26 27 28 29 30      28 29 30                  26 27 28 29 30 31
31

    January 2022
Mo Tu We Th Fr Sa Su
                1  2
 3  4  5  6  7  8  9
10 11 12 13 14 15 16
17 18 19 20 21 22 23
24 25 26 27 28 29 30
31
5
5 案例
5.1 理解需求
- 按照年月统计订单量;
- 给定日期(时间字符串),统计其前后三天的的订单量;
注意点:
- 需求1:读取文件时间,将其转成struct_time时间或者标准字符串时间;
- 需求2:时间字符串转成合理的时间类型,读取文件时间,统计前后三天时间;
- 注意点:如果文件以utf-8方式打开,出现:\ufeff,编码格式修改为:UTF-8-sig
5.2 需求1:按年月统计
分析:
- 当前时间格式及问题,转化的目标格式,先完成时间处理;
- 理解并实现按月统计订单量;
- 函数封装;
5.2.1时间处理
目标格式:“yyyy-mm”
import csv
user_pay_order_path = r"data\user_pay_order.csv"
#读取数据
f = open(user_pay_order_path, encoding=" UTF-8-sig")
csv_reader = csv.DictReader(f)
#读取一行数据
line = next(csv_reader)
print(line)
#获取支付时间
ts = line.get("order_paytime")
print(ts)
#将支付时间转成struct_time
st = datetime.strptime(ts, "%Y/%m/%d %H:%M")
#将struct_time转成年月格式
pay_date = st.strftime("%Y-%m")
print(pay_date)
{'id': '115', 'order_status': '2', 'order_paytype': 'iPhone 6 Plus', 'order_describe': 'requestPayment:fail cancel', 'order_paytime': '2019/3/28 8:32'}
2019/3/28 8:32
2019-03
5.2.2 功能实现
from collections import Counter
def count_order_by_month(fpath):
    #使用Counter统计数量
    counter = Counter()
    f = open(user_pay_order_path, encoding=" UTF-8-sig")
    csv_reader = csv.DictReader(f)
    for line in csv_reader:
        ts = line.get("order_paytime")
        #将支付时间转成struct_time
        st = datetime.strptime(ts, "%Y/%m/%d %H:%M")
        #将struct_time转成年月格式
        pay_date = st.strftime("%Y-%m")
        #统计数量
        counter[pay_date] += 1
    f.close()
    return counter

user_pay_order_path = r"data\user_pay_order.csv"
res = count_order_by_month(user_pay_order_path)
for month, total in res.items():
    print(month, total)
2019-03 54
2019-04 629
2019-05 622
2019-01 3
2019-06 615
2019-07 551
2019-08 448
2019-09 237
2019-10 280
2019-11 340
2019-12 353
2020-01 846
2020-02 819
2020-03 533
2020-04 672
2020-05 532
2020-06 409
2020-07 360
2020-08 485
2020-09 288
2020-10 389
2020-11 317
2020-12 194
2021-01 35
2021-02 19
2021-03 7
2021-04 7
2021-05 2
5.3 需求2:统计7天内数据
理解需求:给定日期,获取前三天,当前,后三天数据,
过滤条件:
方式1:|给定时间日期-订单时间日期| <=3,以日期为准
方式2:|给定时间的时间戳-订单时间戳| <=32460*60,以时间戳为准,更精准
5.3.1 时间处理
from datetime import datetime, date
import time
def sdate_to_date(s, format = "%Y/%m/%d %H:%M"):
    #将时间转date
    t_datetime = datetime.strptime(s, format)
    t_date = t_datetime.date()
    return t_date

def sdate_to_ts(s, format = "%Y/%m/%d %H:%M"):
    #将时间转成时间戳
    st = time.strptime(s, format)
    ts = time.mktime(st)
    return ts

sdate = "2019/3/21 00:00"

print(sdate_to_date(sdate))
print(sdate_to_ts(sdate))
2019-03-21
1553097600.0
5.3.2 计算时间差
- 考虑函数接口与返回值;
- 考虑使用不同方式进行比较;
def is_seven_interval_days(sdate, order_time, cmp_type = "DAY"):
    #默认比较方式:按天
    if cmp_type == "DAY":
        set_date = sdate_to_date(sdate)
        order_date = sdate_to_date(order_time)
        interval = set_date - order_date
        print("DAY:", set_date, order_date)
        return abs(interval.days) <= 3
    else:
        set_ts = sdate_to_ts(sdate)
        ts = sdate_to_ts(order_time)
        print("TS:", set_ts, ts)
        interval = set_ts - ts
        return abs(interval) <= 3*24*60*60

sdate = "2019/3/21 00:00"
order_date = "2019/3/24 23:59"
is_seven_interval_days(sdate, order_date, "TS")
TS: 1553097600.0 1553443140.0


False
5.3.3 代码实现
给定一个日期,遍历订单,统计7天内的订单量;
import csv
def count_order_by_setdate(date, fpath):
    f = open(user_pay_order_path, encoding=" UTF-8-sig")
    csv_reader = csv.DictReader(f)
    order_num = 0
    for line in csv_reader:
        ts = line.get("order_paytime")
        if is_seven_interval_days(date, ts):
            order_num += 1
    f.close()
    return order_num

user_pay_order_path = r"data\user_pay_order.csv"
sdate = "2019/3/27 00:00"
order_num = count_order_by_setdate(sdate, user_pay_order_path)
print(f"在{sdate} 7天内的订单量:{order_num}")
DAY: 2019-03-27 2019-03-28
DAY: 2019-03-27 2019-03-29
DAY: 2019-03-27 2019-03-29
DAY: 2019-03-27 2019-03-29
DAY: 2019-03-27 2019-03-29
DAY: 2019-03-27 2019-03-29
DAY: 2019-03-27 2019-03-29
DAY: 2019-03-27 2019-03-29
DAY: 2019-03-27 2019-03-29
DAY: 2019-03-27 2019-03-29
DAY: 2019-03-27 2019-03-29
DAY: 2019-03-27 2019-03-29
DAY: 2019-03-27 2019-03-29
DAY: 2019-03-27 2019-03-29
DAY: 2019-03-27 2019-03-29
DAY: 2019-03-27 2019-03-29
DAY: 2019-03-27 2019-03-29
DAY: 2019-03-27 2019-03-29
DAY: 2019-03-27 2019-03-30
DAY: 2019-03-27 2019-03-30
DAY: 2019-03-27 2019-03-30
DAY: 2019-03-27 2019-03-30
DAY: 2019-03-27 2019-03-30
DAY: 2019-03-27 2019-03-30
DAY: 2019-03-27 2019-03-30
...
DAY: 2019-03-27 2021-04-20
DAY: 2019-03-27 2021-05-12
DAY: 2019-03-27 2021-05-16
在2019/3/27 00:00 7天内的订单量:40
(四)文件与目录处理
1 文件与目录处理
OS模块模块提供了操作系统相关功能的函数,比如:获取系统信息,文件与目录的操作,执行系统命令
等;
官方文档:https://docs.python.org/zh-cn/3.7/library/os.html
- 目录操作
- 创建目录
- 删除/复制/移动目录
- 遍历目录
- 获取目录下所有文件
- 获取目录及子目录下所有文件
- 其他操作
- 是否是文件/目录
- 文件目录是否存在
- 路径拼接
import os
import shutil
2 目录操作
| 函数 | 说明 |
|---|---|
os.getcwd() |
返回表示当前工作目录。 |
os.mkdir(name) |
创建目录。 |
os.rmdir(name) |
删除目录。 |
os.makedirs(name) |
创建目录树。 |
os.removedirs(name) |
删除目录。 |
os.listdir(path=None) |
获取指定目录下所有文件和目录的列表。 |
os.rename(src, dst) |
文件或目录重命名。 |
os.renames(old, new) |
递归方式重命名目录或者文件。 |
os.walk(top, topdown=True) |
获取指定目录下所有文件和目录,返回目录树迭代器。 |
# 1. 获取当前工作目录
current_directory = os.getcwd()
print("当前工作目录:", current_directory)
当前工作目录: d:\Study\Computer Science\驭风计划\1 Python学习\PythonLearning\4 文件
# 2. 创建目录
new_directory = "data/example_directory"
os.mkdir(new_directory)
print(f"目录 '{new_directory}' 已创建")
目录 'data/example_directory' 已创建
# 3. 获取指定目录下所有文件和目录的列表
files_and_directories = os.listdir(current_directory)
print("当前工作目录下的文件和目录:", files_and_directories)
当前工作目录下的文件和目录: ['4 文件.ipynb', 'data']
# 4. 重命名文件或目录
old_name = "data/example_directory"
new_name = "data/renamed_directory"
os.rename(old_name, new_name)
print(f"'{old_name}' 已重命名为 '{new_name}'")
'data/example_directory' 已重命名为 'data/renamed_directory'
# 5. 获取指定目录下所有文件和目录,返回目录树迭代器
top_directory = os.getcwd()
for root, dirs, files in os.walk(top_directory):
    print(f"当前目录: {root}")
    print("子目录:", dirs)
    print("文件:", files)
    print("\n")
当前目录: d:\Study\Computer Science\驭风计划\1 Python学习\PythonLearning\4 文件
子目录: ['data']
文件: ['4 文件.ipynb']
当前目录: d:\Study\Computer Science\驭风计划\1 Python学习\PythonLearning\4 文件\data
子目录: [‘renamed_directory’, ‘啊’]
文件: [‘2017_data.csv’, ‘china_stastic.csv’, ‘csv_dictwrite_test.csv’, ‘csv_write_test.csv’, ‘data.zip’, ‘encode_test.txt’, ‘excel_font_test.xlsx’, ‘netconfig.ini’, ‘online_order.xlsx’, ‘online_order_small.xlsx’, ‘pr001_sales_report.txt’, ‘russian_demography.csv’, ‘sales_count.xlsx’, ‘sales_report.txt’, ‘test.txt’, ‘test.xlsx’, ‘user_pay_order.csv’, ‘write_only.txt’, ‘write_read.txt’, ‘write_test.txt’, ‘write_test.xlsx’]
当前目录: d:\Study\Computer Science\驭风计划\1 Python学习\PythonLearning\4 文件\data\renamed_directory
子目录: []
文件: []
当前目录: d:\Study\Computer Science\驭风计划\1 Python学习\PythonLearning\4 文件\data\啊
子目录: [‘renamed_directory’]
文件: [‘2017_data.csv’, ‘china_stastic.csv’, ‘csv_dictwrite_test.csv’, ‘csv_write_test.csv’, ‘encode_test.txt’, ‘excel_font_test.xlsx’, ‘netconfig.ini’, ‘online_order.xlsx’, ‘online_order_small.xlsx’, ‘pr001_sales_report.txt’, ‘russian_demography.csv’, ‘sales_count.xlsx’, ‘sales_report.txt’, ‘test.txt’, ‘test.xlsx’, ‘user_pay_order.csv’, ‘write_only.txt’, ‘write_read.txt’, ‘write_test.txt’, ‘write_test.xlsx’]
当前目录: d:\Study\Computer Science\驭风计划\1 Python学习\PythonLearning\4 文件\data\啊\renamed_directory
子目录: []
文件: []
(五)excel文件详解
1 excel文件
openpyxl安装:pip install openpyxyl
官方文档:https://openpyxl.readthedocs.io/en/stable/
1.1 excel操作过程
- 打开excel文件;
- 获取指定的sheet;
- 对sheet中的行列单元格进行操作;
- 保存并关闭文件;
1.2 打开关闭excel文件
目标:
- 打开excel;
- 获取所有的sheet;
- 根据名称获取sheet;
| 方法 | 说明 |
|---|---|
wb = load_workbook('xx.xlsx') |
打开 Excel 文件。 |
wb.sheetnames |
获取所有 sheet 名称。 |
sheet = wb[sheetname] |
根据名称获取 sheet。 |
wb.active |
获取当前默认的 sheet。 |
wb.close() |
关闭文件。 |
wb.save(filename) |
将当前的 workbook 保存到指定的路径。 |
#导入模块
from openpyxl import load_workbook
order_path = r'data\online_order.xlsx'

#打开excel文件
wb = load_workbook(order_path)
#获取sheet的名称
sheetnames = wb.sheetnames
for sheetname in sheetnames:
    print("sheet name:", sheetname)

current_sheet = wb[sheetname]
print(current_sheet)

wb.close()
sheet name: Sheet1
1.3 excel内容读取
目标:
- 获取指定单元格及内容
- 获取指定行及内容
- 获取指定列及内容
- 获取指定范围及内容
| 方法 | 说明 |
|---|---|
cell = sheet["A1"] |
获取一个单元格。 |
cell.value |
获取单元格数据。 |
sheet['A'] |
获取第 A 列数据单元。 |
sheet['A':'B'] |
获取第 A 到 B 列数据单元。 |
sheet[n] |
获取第 n 行数据单元。 |
sheet[m:n] |
获取 m 到 n 行数据单元。 |
sheet["A1":"C5"] |
获取指定行列范围的数据单元。 |
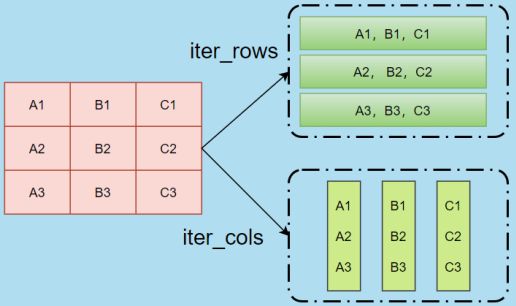
ws.iter_cols(min_col, max_col, min_row, max_row) |
返回指定范围数据单元迭代器,按列返回。 |
ws.iter_rows(min_col, max_col, min_row, max_row) |
返回指定范围数据单元迭代器,按行返回。 |
sheet.max_row |
获取当前 sheet 中最大行。 |
sheet.max_column |
获取当前 sheet 中最大列。 |
1.4 iter_cols与iter_rows说明
1.5 练习
需求:
- 计算当前总销售额;
- 计算笔单价(每笔成交的平均金额);
基本思路:
- 打开excel文件,获取sheet;
- 找到"支付金额",获取数值;
- 计算销售额与客单价;
具体实现:
from openpyxl import load_workbook
order_path = r'data\online_order_small.xlsx'
#打开文件
wb = load_workbook(order_path)
#获取当前sheet
ws = wb.active
#获取表格
pay_col = ws["D2":"D10"]
#获取支付金额
pay_ment_list = [cell[0].value for cell in pay_col[2:10]]
#计算总销售额
total = sum(pay_ment_list)
#计算笔单价
pay_average = round(total/len(pay_ment_list), 2)
#输出结果
print(f"销售额:{total}, 笔单价:{pay_average}")
销售额:277.5, 笔单价:39.64
1.6 Excel写入
| 方法 | 说明 |
|---|---|
wb = Workbook() |
创建 workbook 对象。 |
sheet = wb.active |
获取当前 sheet。 |
wb.create_sheet(title=None, index=None) |
创建新的 sheet,title 为 sheet 名称。 |
wb.remove(sheet) |
根据名称删除 sheet。 |
sheet['A1'] = 42 |
设置单元格值。 |
sheet.append([1, 2, 3]) |
插入一行数据。 |
wb.save(fpath) |
保存数据到 Excel。 |
from openpyxl import Workbook
f_path = r'data\write_test.xlsx'
#创建Workbook对象
test_wb = Workbook()
#创建sheet1
ws = test_wb.create_sheet('sheet1', 0)
#添加一行数据
ws.append([1,2,3,4])
#添加一行数据
ws.append([4,5,6,7])
#设置指定的单元格
ws['A3'] = 10
#保存文件
test_wb.save(f_path)
2 练习
需求:
- 统计每个省份的销售额,订单量;
- 按照省份将数据拆分,保存到新的excel的sheet中,sheet以省份命名;
2.1 按照省份统计
基本流程:
- 理解需求,
- 理解数据,
- 数据结构选择,
- 订单状态处理,
- 指标计算,
数据结构格式:
{
'江苏省': defaultdict(float, {'num': 4463.0, 'payment': 358718.3}),
'广东省': defaultdict(float, {'num': 5828.0, 'payment': 449990.8}),
'辽宁省': defaultdict(float, {'num': 1076.0, 'payment': 77805.4}),
'广西壮族自治区': defaultdict(float, {'num': 564.0, 'payment': 42123.1}),
}
数据处理:
- 使用列号(数字)获取每列数值,问题:如果新增列,需要修改列值;
- 将字段与数据处理成字典,根据字段名获取数据值,好处:只要列名不变,代码不需要修改;
代码实现:
#导入模块
from openpyxl import Workbook
from collections import defaultdict

def count_order(wb):
    ws = wb.active
    #rows为迭代器
    rows = ws.rows
    #第一行字段不要
    row = next(rows)
    col_names = [cell.value for cell in row]
    result = {}
    status_success = "交易成功"
    #获取数据
    for row in rows:
        #获取每行数据
        values = [cell.value for cell in row]
        #列名与数值构成字典
        order_info = dict(zip(col_names, values))
        #获取省份,订单状态,支付金额
        province = order_info.get("省份")
        order_status = order_info.get("订单状态")
        order_pay = order_info.get("支付金额")

        if province and order_status == status_success and province in result:
            #当前数据有效,且该省份在当前的结果中
            info = result.get(province)
            info["num"] += 1
            info["payment"] += order_pay
            info["payment"] = round(info["payment"], 3)

        elif province and order_status == status_success:
            #当前数据有效,且当前省份没有在当前结果中
            info = defaultdict(float)
            result[province] = info
            info["num"] += 1
            info["payment"] += order_pay
            info["payment"] = round(info["payment"], 3)
    return result

#目录
fpath = r"data\online_order.xlsx"
#打开Excel
wb = load_workbook(fpath)
#数据统计
res = count_order(wb)
res
{'江苏省': defaultdict(float, {'num': 4463.0, 'payment': 358718.3}),
 '广东省': defaultdict(float, {'num': 5828.0, 'payment': 449990.8}),
 '辽宁省': defaultdict(float, {'num': 1076.0, 'payment': 77805.4}),
 '广西壮族自治区': defaultdict(float, {'num': 564.0, 'payment': 42123.1}),
 '安徽省': defaultdict(float, {'num': 1497.0, 'payment': 116101.8}),
 '浙江省': defaultdict(float, {'num': 4752.0, 'payment': 438293.0}),
 '四川省': defaultdict(float, {'num': 2000.0, 'payment': 165557.6}),
 '湖南省': defaultdict(float, {'num': 1146.0, 'payment': 92685.6}),
 '湖北省': defaultdict(float, {'num': 1057.0, 'payment': 71982.1}),
 '云南省': defaultdict(float, {'num': 422.0, 'payment': 39025.4}),
 '重庆': defaultdict(float, {'num': 1011.0, 'payment': 90373.4}),
 '上海': defaultdict(float, {'num': 2952.0, 'payment': 231125.3}),
 '黑龙江省': defaultdict(float, {'num': 565.0, 'payment': 40783.5}),
 '贵州省': defaultdict(float, {'num': 414.0, 'payment': 34442.8}),
 '天津': defaultdict(float, {'num': 848.0, 'payment': 62716.4}),
 '福建省': defaultdict(float, {'num': 1278.0, 'payment': 87215.8}),
 '山东省': defaultdict(float, {'num': 2198.0, 'payment': 157410.8}),
 '北京': defaultdict(float, {'num': 2015.0, 'payment': 173628.1}),
 '江西省': defaultdict(float, {'num': 789.0, 'payment': 62206.7}),
 '河北省': defaultdict(float, {'num': 1268.0, 'payment': 93188.4}),
 '内蒙古自治区': defaultdict(float, {'num': 245.0, 'payment': 28835.1}),
 '河南省': defaultdict(float, {'num': 1630.0, 'payment': 115762.8}),
 '陕西省': defaultdict(float, {'num': 912.0, 'payment': 71579.2}),
 '山西省': defaultdict(float, {'num': 528.0, 'payment': 39802.6}),
 '海南省': defaultdict(float, {'num': 146.0, 'payment': 14915.9}),
 '吉林省': defaultdict(float, {'num': 460.0, 'payment': 29808.5}),
 '甘肃省': defaultdict(float, {'num': 133.0, 'payment': 13837.5}),
 '青海省': defaultdict(float, {'num': 33.0, 'payment': 3553.0}),
 '宁夏回族自治区': defaultdict(float, {'num': 65.0, 'payment': 6336.0}),
 '新疆维吾尔自治区': defaultdict(float, {'num': 38.0, 'payment': 6469.9}),
 '西藏自治区': defaultdict(float, {'num': 5.0, 'payment': 788.6}),
 '无锡市': defaultdict(float, {'num': 1.0, 'payment': 8.4})}
wb.close()
2.2 按照省份进行拆分
基本流程:
- 打开原文件,新建workbook,
- 读取源文件,获取省份,
- 在新workbook中添加对应的省份的sheet,
- 将省份对应的数据添加到sheet中
写入方式:
- 方式1:将省份对应的数据整理好之后,统一写入;
- 方式2:读取一行,写入到对应的sheet中,如果sheet不存在则在新的workbook中创建对应的sheet,然后写入;
本题目,使用第二种方式实现;
from openpyxl import load_workbook
from openpyxl import Workbook

def split_order_by_field(src_path, des_path, field):
    sheet_map = {}
    #打开源文件
    src_wb = load_workbook(src_path)
    #创建写对象
    dest_wb = Workbook()
    #获取当前数据的字段
    src_sheet = src_wb.active
    rows = src_sheet.rows
    row = next(rows)
    #获取字段值
    column_names = [cell.value for cell in row]
    for row in rows:
        #获取一行数据
        values = [cell.value for cell in row]
        #转成字典
        order_info = dict(zip(column_names, values))
        #根据字段进行拆分
        field_value = order_info.get(field)
        #根据字段对应值,找到sheet
        if field_value and field_value in sheet_map:
            sheet = sheet_map.get(field_value)
            sheet.append(values)
        else:
            #如果没有对应的sheet,创建新的sheet
            sheet = dest_wb.create_sheet(field_value)
            sheet.append(column_names)
            sheet.append(values)
            sheet_map[field_value] = sheet
    src_wb.close()
    dest_wb.save(des_path)

src_path = r"data\online_order.xlsx"
dest_path = r"data\online_order_split.xlsx"
split_order_by_field(src_path, dest_path, "省份")
3 excel格式设置
官方文档:https://openpyxl.readthedocs.io/en/stable/styles.html
单元格设置:
| 属性 | 说明 |
|---|---|
cell.value |
获取单元格内的值。 |
cell.font |
设置单元格内的字体样式。 |
cell.fill |
设置单元格内的填充颜色。 |
cell.alignment |
设置单元格内的对齐方式。 |
cell.border |
设置单元格内的边框样式。 |
3.1 字体设置
默认设置:
from openpyxl.styles import PatternFill, Border, Side, Alignment, Protection,Font
#字体设置
font = Font(name='Calibri', size=11, bold=False, italic=False, vertAlign=None,
            underline='none', strike=False, color='FF000000')
3.2 单元格设置
默认设置
#填充设置
fill = PatternFill(fill_type=None, start_color='FFFFFFFF',end_color='FF000000')
#边框设置
border = Border(left=Side(border_style=None, color='FF000000'))
#对齐设置
alignment=Alignment(horizontal='general', vertical='bottom', text_rotation=0,
                    wrap_text=False, shrink_to_fit=False, indent=0)
填充类型选择:
通过dir(fills)查看,主要填充类型,对应值为字符串,
例如:fills.FILL_PATTERN_DARKGRAY,结果:darkGray:
'FILL_NONE', 'FILL_PATTERN_DARKDOWN','FILL_PATTERN_DARKGRAY',
'FILL_PATTERN_DARKGRID', 'FILL_PATTERN_DARKHORIZONTAL',
'FILL_PATTERN_DARKTRELLIS', 'FILL_PATTERN_DARKUP',
'FILL_PATTERN_DARKVERTICAL','FILL_PATTERN_GRAY0625','FILL_PATTERN_GRAY125','FILL_PATTERN_LIGHTDOWN',
'FILL_PATTERN_LIGHTGRAY','FILL_PATTERN_LIGHTGRID','FILL_PATTERN_LIGHTHORIZONTAL'
,'FILL_PATTERN_LIGHTTRELLIS','FILL_PATTERN_LIGHTUP','FILL_PATTERN_LIGHTVERTICAL'
,'FILL_PATTERN_MEDIUMGRAY','FILL_SOLID',
3.3 格式设置练习
from openpyxl.styles import colors
from openpyxl.styles import Font, Color
from openpyxl.styles import PatternFill
from openpyxl import Workbook
fpath = r'data\excel_font_test.xlsx'
wb = Workbook()
ws = wb.active

#A1设置颜色
ft1 = Font(color="FF0000")
a1_cell = ws["A1"]
a1_cell.font = ft1
a1_cell.value = "兰陵王"

#A2设置颜色,大小,字体
ft2 = Font(name='微软雅黑', size=14, color="00808000")
a2_cell = ws["A2"]
a2_cell.font = ft2
a2_cell.value = "孙悟空"

#A2设置颜色,大小,字体, 下划线
ft3 = Font(name='隶书', size=14, color="00FF00FF", underline="single")
a3_cell = ws["A3"]
a3_cell.font = ft3

#设置填充色
fill = PatternFill(fill_type="solid",start_color='0000DD',end_color='FF000000')
a3_cell.fill = fill
a3_cell.value = "亚瑟"

wb.save(fpath)
3.4 销售数据练习
产生随机销售数据,数值范围:[50:100],数据格式:
| 姓名 | Q1 | Q1 | Q3 | Q4 |
|---|---|---|---|---|
| id01 | 90 | 100 | 88 | 77 |
| id02 | 77 | 95 | 90 | 80 |
将数据写入excel, 并将销售总额排名前5,姓名设置为红色;
步骤:
- 产生数据
- 统计数据
- 排序
- 写入数据,并设置格式
数据格式:
data = {
"id01":[90, 100, 88, 77],
"id02":{90, 77, 67, 97},
....
....
"id10":{88, 98, 54, 77},
}
import random
def gen_item():
    start = 50
    end = 101
    vals = []
    for i in range(4):
        vals.append(random.randint(start, end))
    return vals

def gen_data(num):
    uid = ["id%02d"%i for i in range(1, num+1)]
    values = [gen_item() for i in range(1, num+1)]
    data = dict(zip(uid, values))
    return data

data = gen_data(10)
data
{'id01': [63, 95, 54, 71],
 'id02': [88, 64, 82, 57],
 'id03': [53, 97, 76, 93],
 'id04': [59, 74, 91, 95],
 'id05': [89, 81, 95, 88],
 'id06': [63, 78, 86, 99],
 'id07': [64, 93, 82, 72],
 'id08': [66, 54, 57, 83],
 'id09': [55, 57, 97, 94],
 'id10': [52, 68, 90, 80]}
按照销售额统计数据
#求和函数
def sum_func(item):
    return sum(item[1])

#排序获取排名前5的数据
max_five = sorted(data.items(),key=sum_func, reverse=True)[:5]
max_five_key = [item[0] for item in max_five]
max_five_key
['id05', 'id06', 'id03', 'id04', 'id07']
写入数据
from openpyxl.styles import colors
from openpyxl.styles import Font, Color
from openpyxl import Workbook

def save_data_to_excel(fpath, data, max_five):
    #第一行为字段
    fields = ["姓名", "Q1", "Q2", "Q3", "Q4"]
    #设置单元格字体颜色
    ft = Font(color="FF0000")
    #打开excel
    wb = Workbook()
    ws = wb.active
    #添加字段
    ws.append(fields)
    i = 1
    #获取数据
    for key,v in data.items():
        i += 1
        row = list(v)
        row.insert(0, key)
        ws.append(row)
        #若该员工排名前5,设置其字体格式
        if key in max_five:
            cell_name = "A%d"%i
            cell = ws[cell_name]
            cell.font = ft
    #保存文件
    wb.save(fpath)

fpath = r'data\sales_count.xlsx'
save_data_to_excel(fpath, data, max_five_key)
4 excel公式与图表应用
4.1 公式应用
准备工作,熟悉excel常用的公式,例如:
| 公式 | 说明 |
|---|---|
=AVERAGE(A1,A5) |
求均值,计算 A1 和 A5 中数值的平均值。 |
=SUM(A1, A6) |
求和,计算 A1 和 A6 中数值的总和。 |
练习,计算每个科目的平均分,并将excel另存;
from openpyxl import load_workbook
path = r'data\test.xlsx'
spath = r'data\t_2.xlsx'
wb = load_workbook(path)
ws = wb['Sheet']
#获取
max_row = ws.max_row
#插入行为最大行+1
insert_row = max_row+1
#插入计算值:=AVERAGE(A1:A4)
formula = '=AVERAGE(%s1:%s%d)'
#插入位置分别为:CD;
ws['C%d'%insert_row] = formula%('C','C', max_row)
ws['D%d'%insert_row] = formula%('D','D', max_row)
#保存
wb.save(spath)
6 excel插入图表
建议参考文档:https://openpyxl.readthedocs.io/en/stable/charts/introduction.html
需求:在上面excel中添加柱状图,对比每个学生各科课程
from openpyxl import load_workbook
from openpyxl.chart import BarChart, Reference
path = r'data\test.xlsx'
spath = r'data\chart_bar.xlsx'

wb = load_workbook(path)
ws = wb['Sheet']
chart1 = BarChart()
chart1.type = "col"
chart1.style = 10
chart1.title = "成绩对比图表"
chart1.y_axis.title = '成绩'
chart1.x_axis.title = '姓名'
#选择数据区域
data = Reference(ws, min_col=3, min_row=1, max_row=5, max_col=4)
#选择cats区域
cats = Reference(ws, min_col=2, min_row=2, max_row=5)
#添加数据
chart1.add_data(data, titles_from_data=True)
#添加类别
chart1.set_categories(cats)
chart1.shape = 4
#图表位置
ws.add_chart(chart1, "A10")
#保存添加图表
wb.save(spath)
(六)json 与 picke
1 序列化与反序列化
- 序列化:将对象转成字节流,例如:机器学习模型转成字节流,保存到文件;
- 反序列化:将字节流转成对象,例如:读取文件,将字节流转成机器学习模型;
- Json:部分python对象转Json字符串、Json字符串转Python对象
- Pickle:对象转pickle字节流、pickle字节流转对象
2 Json
2.1 Json简介
json:一种轻量级的数据交换格式,文本序列化,具有一定的可读性;
主要作用:网络数据传输,数据存储,交换等
使用场景:
- 前端与后台请求数据格式;
- mysql中数据存储;
- 分布式爬虫中,将数据保存到redis等;
2.2 Json模块及主要方法
模块导入:import json
主要方法:
| 方法 | 说明 |
|---|---|
json.dumps(obj, ...) |
将对象转成 JSON 字符串,前提是 obj 对象支持该序列化方式。 |
json.loads(s, ...) |
将 JSON 字符串转成 Python 对象。 |
json.dump(obj, fp, ...) |
将对象以 JSON 格式写入文件,前提是 obj 对象支持该序列化方式。 |
json.load(fp, ...) |
将 JSON 文件数据转成 Python 对象。 |
2.3 Json练习
Json序列化与反序列化
import json
info = {"华为":"鸿蒙", "Google":"android", "Apple":"IOS"}
#将python对象对转成json数据
json_data = json.dumps(info)
print(json_data)
#将Json数据转成python对象
data = json.loads(json_data)
print(data)
{"\u534e\u4e3a": "\u9e3f\u8499", "Google": "android", "Apple": "IOS"}
{'华为': '鸿蒙', 'Google': 'android', 'Apple': 'IOS'}
Json文件存储与读取
import json
fpath = r"data\test_obj.json"
info = {"华为":"鸿蒙", "Google":"android", "Apple":"IOS"}
#将python对象对象转成json数据
fw = open(fpath, "w")
json.dump(info, fw)
print("save info to file")
fw.close()
fr = open(fpath)
# #将Json数据转成python对象
data = json.load(fr)
print(data)
save info to file
{'华为': '鸿蒙', 'Google': 'android', 'Apple': 'IOS'}
3 pickle模块
pickle是Python中特有的,用于二进制序列化与反序列模块,序列化后不具有可读性;
3.1 pickle模块及主要方法
模块导入:import pickle
主要方法:
| 方法 | 说明 |
|---|---|
pickle.dumps(obj, ...) |
将 Python 对象序列化为字节流。 |
pickle.loads(data, ...) |
将字节流反序列化为 Python 对象。 |
pickle.dump(obj, file, ...) |
将对象以字节流方式保存到文件,file 为文件对象,以“wb”方式打开。 |
pickle.load(file, ...) |
将文件字节流反序列化为 Python 对象,file 为文件对象,以"rb"方式打开。 |
3.2 pickle练习
序列化与反序列化
import pickle
info = {"华为":"鸿蒙", "Google":"android", "Apple":"IOS"}
pickle_data = pickle.dumps(info)
print(pickle_data)
data = pickle.loads(pickle_data)
print(data)
b'\x80\x04\x958\x00\x00\x00\x00\x00\x00\x00}\x94(\x8c\x06\xe5\x8d\x8e\xe4\xb8\xba\x94\x8c\x06\xe9\xb8\xbf\xe8\x92\x99\x94\x8c\x06Google\x94\x8c\x07android\x94\x8c\x05Apple\x94\x8c\x03IOS\x94u.'
{'华为': '鸿蒙', 'Google': 'android', 'Apple': 'IOS'}
pickle文件存储与读取
import pickle
fpath = r"data\test_obj.pickle"
info = {"华为":"鸿蒙", "Google":"android", "Apple":"IOS"}
#将python对象对象转成json数据
fw = open(fpath, "wb")
pickle.dump(info, fw)
print("save info to file")
fw.close()
fr = open(fpath, "rb")
# #将pcikle转成python对象
data = pickle.load(fr)
print(data)
save info to file
{'华为': '鸿蒙', 'Google': 'android', 'Apple': 'IOS'}
(七)ini配置文件处理
1 .ini文件格式
.ini 文件是Initialization File的缩写,即初始化文件,被用于配置文件,例如:mysql等的配置文件;
ini文件由:节,键,值组成;
- 文件格式:
节 [section] 参数 (键=值) name=value - mysql配置文件:
[mysqld_safe] socket = /var/run/mysqld/mysqld.sock nice = 0 [mysqld] user = mysql pid-file = /var/run/mysqld/mysqld.pid socket = /var/run/mysqld/mysqld.sock port = 3306 - ini文件主要操作:
- 获取节下面的键及对应的值;
- 添加,修改节或者下面的键或者值;
2 configparser模块
模块导入:from configparser import ConfigParser
2.1 读取相关方法
| 方法 | 说明 |
|---|---|
config = ConfigParser() |
创建 ConfigParser 对象。 |
config.read(fpath, encoding='utf-8') |
导入配置文件。 |
config.sections() / config.items() |
获取所有的 section 名称 / 名称与 section。 |
config.values() |
返回每个 section。 |
config.keys() / config.values() |
获取所有的 sections 的 key / section。 |
config.has_section(section) |
检查是否包含指定的 section。 |
config.has_option(section, option) |
检查指定的 section 是否包含指定的 option。 |
config.get(section, option, *, raw=False, ...) |
获取指定 section 下指定 key 对应的 value。 |
2.2 读取操作
2.2.1 打开文件
from configparser import ConfigParser
fpath = r'data\netconfig.ini'
config = ConfigParser()
config.read(fpath, encoding='utf-8')
['data\\netconfig.ini']
2.2.2 读取session
#获取所有的节
sections = config.sections()
print(sections)
#获取所有的item
items = list(config.items())
print(items)
['baidu', 'jingdong']
[('DEFAULT', ), ('baidu', ), ('jingdong', )]
2.2.3 section与key判断
res = config.has_section('baidu')
print(res)
config.has_option('baidu', 'addr')
print(res)
True
True
2.2.4 读取值
#通过节,键找到对应的值
baidu_src = config.get('baidu', 'src')
print("src:", baidu_src)
#获取节
baidu = config['baidu']
#通过节找到键对应的值
baidu_addr = baidu.get('addr')
print("addr:", baidu_addr)
src: www.baidu.com
addr: 北京
2.3 ini文件写入
2.3.1 创建ConfigParser对象
from configparser import ConfigParser
fpath = r'data\new_config.ini'
config = ConfigParser()
#可以在原来基础上添加信息
#config.read(fpath, encoding='utf-8')
2.3.2 添加sesction
config.add_section('tencent')
2.3.3 添加key_value
config.set('tencent', 'addr', '深圳')
config.set('tencent', 'src', 'https://www.tencent.com/')
2.3.4 保存到文件
fwpath = r'data\netconfig1.ini'
f = open(fwpath, 'w', encoding='utf-8')
config.write(f)
f.close()