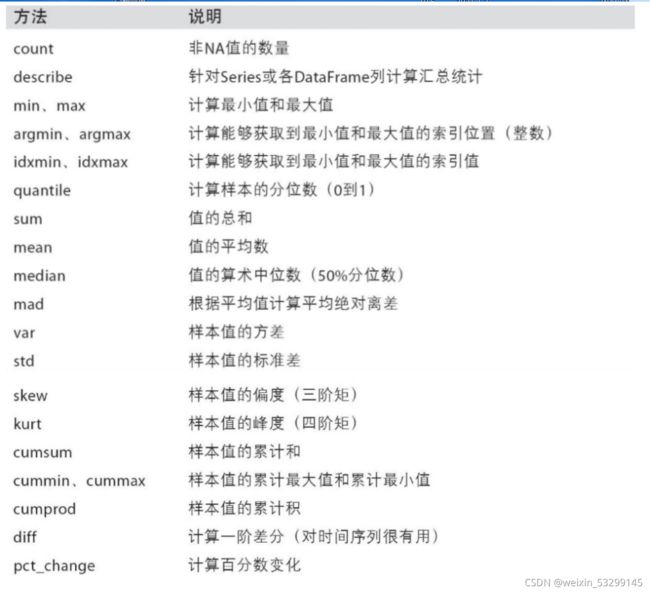
Pandas常用统计数据方法
import pandas as pd
1、准备数据
假设有 5 个人,分别参加了 4 门课程,获得了对应的分数
同时这个 5 个人分别负责的项目个数 在 ‘Project_num’ 列中显示
data = {‘name’ : pd.Series([‘Alice’, ‘Bob’, ‘Cathy’, ‘Dany’, ‘Ella’, ‘Ford’, ‘Gary’, ‘Ham’, ‘Ico’, ‘Jack’]),
    'Math_A' : pd.Series([1.1, 2.2, 3.3, 4.4, 5, 3.2, 2.4, 1.5, 4.3, 4.5]),

    'English_A' : pd.Series([3, 2.6, 2, 1.7, 3, 3.3, 4.4, 5, 3.2, 2.4]),

    'Math_B' : pd.Series([1.7, 2.5, 3.6, 2.4, 5, 2.2, 3.3, 4.4, 1.5, 4.3]),

    'English_B' : pd.Series([5, 2.6, 2.4, 1.3, 3, 3.6, 2.4, 5, 2.2, 3.1]),

    'Project_num' : pd.Series([2, 3, 0, 1, 7, 2, 1, 5, 3, 4]),

    'Sex' : pd.Series(['F', 'M', 'M', 'F', 'M', 'F', 'M', 'M', 'F', 'M'])

 }
df = pd.DataFrame(data)
print(df)
print(“----------------”)
print(df.median())
print(“----------------”)
2、数据的总体描述
统计行数 len(df)
print(len(df)) # 不包括表头(列标签)
统计有多少种不同的值 df[‘lable’].nunique()
这些人中有多少种性别呢
print(df[‘Sex’].nunique())
对 列 中每种不同的值 进行计数 df[‘lable’].value_counts()
统计每种性别有多少人数
print(df[‘Sex’].value_counts())
整体统计描述 df.describe()
仅对数值型
对整张表格进行统计描述(这里仅对数值形的列进行统计)
print(“----------------”)
print(df.describe())
print(“----------------”)
对所有类型 df.describe(include=‘all’)
对整张表格进行统计描述(所有类型进行统计)
print(df.describe(include=‘all’))
对指定的列
对指定的列进行统计描述
print(“----------------”)
print(df.Math_A.describe())
print(“----------------”)
3、指定统计方式
求和 sum()
print(df.Project_num.sum())
计数 df.count()
print(df.count())
中位数 df.median()
print(df.median())
分位数 df.quantile()
print(df.quantile([0.25,0.75]))
最大值 / 最小值 df.max() / df.min()
print(df.max())
print(df.min())
字符串在计算机表示中也是有大小区别的
均值 df.mean()
仅对数值类型进行求解
print(df.mean())
方差 / 标准差 df.var() / df.std()
仅对数值类型进行求解
print(df.var())
print(df.std())
4、批量操作 df.apply()(对每个元素应用同一个自定义函数)
对整张表格
def double (x):
return x*2
print(df.apply(double))
对于数值就是 乘以 2
但是对于字符串,那就是重复2遍的操作
对指定的列
def double (x):
return x*2
print(df.Math_B.apply(double))