翻译: 使用 GPT-4 将Jupyter Notebook 转换为Streamlit
GPT-4 提升Streamlit 应用系列
- 翻译: 使用 GPT-4 将您的 Streamlit 应用程序提升到一个新的水平一
1 . 在几分钟内将 Jupyter 笔记本转换为 Streamlit 应用程序
如果从头开始创建 Streamlit 应用程序很有趣,那么将 Jupyter 笔记本转换为 Streamlit 应用程序就更有趣了!
GPT-4 可以无缝地自动执行大部分转换步骤,例如:
- 用 Streamlit 语法替换传统的 Python 语法。
- 删除特定于 Jupyter 的导入并将其替换为特定于 Streamlit 的导入。
- 不包括 Jupyter 特定的组件,例如 cell magics (%%) 和注释。
下面是一个 Jupyter 笔记本。我要求 GPT-4 将其转换为 Streamlit 应用程序。
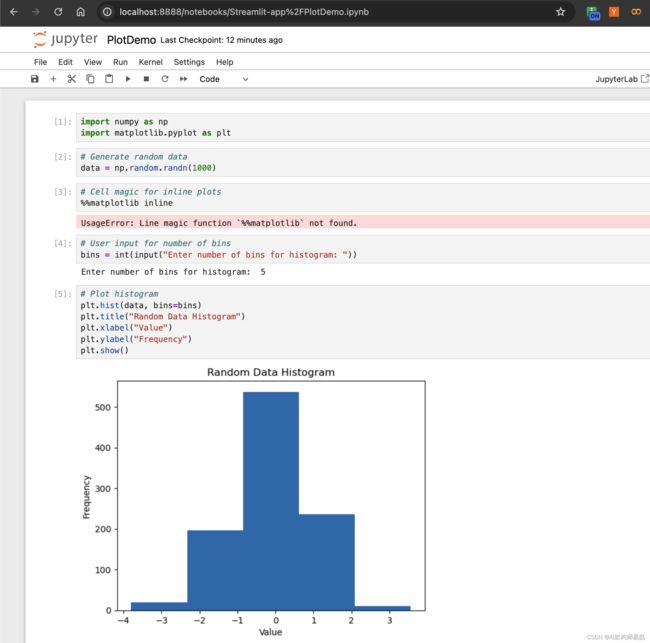
Jupyter Notebook — GPT-4 处理之前:
{
 "cells": [
  {
   "cell_type": "code",
   "execution_count": null,
   "id": "6d9d961b-ab13-41eb-97fc-d8cdef4643eb",
   "metadata": {},
   "outputs": [],
   "source": [
    "import numpy as np\n",
    "import matplotlib.pyplot as plt"
   ]
  },
  {
   "cell_type": "code",
   "execution_count": null,
   "id": "a52d5c00-fe6c-4aca-bc9d-53d0d5e712ae",
   "metadata": {},
   "outputs": [],
   "source": [
    "# Generate random data\n",
    "data = np.random.randn(1000)"
   ]
  },
  {
   "cell_type": "code",
   "execution_count": null,
   "id": "b5ffc30a-e93c-44f6-8e8f-f680b5d2689e",
   "metadata": {},
   "outputs": [],
   "source": [
    "# Cell magic for inline plots\n",
    "%%matplotlib inline"
   ]
  },
  {
   "cell_type": "code",
   "execution_count": null,
   "id": "a0a2f8b7-79ba-4600-86e8-d76ae0f74cae",
   "metadata": {},
   "outputs": [],
   "source": [
    "# User input for number of bins\n",
    "bins = int(input(\"Enter number of bins for histogram: \"))"
   ]
  },
  {
   "cell_type": "code",
   "execution_count": null,
   "id": "72e7e336-bb35-4967-b9a0-f07e1cee7918",
   "metadata": {},
   "outputs": [],
   "source": [
    "# Plot histogram\n",
    "plt.hist(data, bins=bins)\n",
    "plt.title(\"Random Data Histogram\")\n",
    "plt.xlabel(\"Value\")\n",
    "plt.ylabel(\"Frequency\")\n",
    "plt.show()"
   ]
  },
  {
   "cell_type": "code",
   "execution_count": null,
   "id": "ca6c914c-6eb1-441e-b334-27d20dff08aa",
   "metadata": {},
   "outputs": [],
   "source": []
  }
 ],
 "metadata": {
  "kernelspec": {
   "display_name": "Python 3 (ipykernel)",
   "language": "python",
   "name": "python3"
  },
  "language_info": {
   "codemirror_mode": {
    "name": "ipython",
    "version": 3
   },
   "file_extension": ".py",
   "mimetype": "text/x-python",
   "name": "python",
   "nbconvert_exporter": "python",
   "pygments_lexer": "ipython3",
   "version": "3.11.5"
  }
 },
 "nbformat": 4,
 "nbformat_minor": 5
}
prompt
请把下面的jupyter notebook代码转换为 Streamlit应用程序
转换后的 Streamlit 应用程序 — 经过 GPT-4 处理:
import streamlit as st
import numpy as np
import matplotlib.pyplot as plt

# App title
st.title("Random Data Histogram")

# Generate random data
data = np.random.randn(1000)

# User input for number of bins
bins = st.slider("Enter number of bins for histogram:", min_value=1, max_value=100, value=10)

# Plot histogram
fig, ax = plt.subplots()
ax.hist(data, bins=bins)
ax.set_title("Random Data Histogram")
ax.set_xlabel("Value")
ax.set_ylabel("Frequency")

# Display the plot
st.pyplot(fig)
要运行这个Streamlit应用程序:
- 将脚本保存为一个Python文件(例如,
histogram_app.py)。 - 如果尚未安装Streamlit,请安装它:
pip install streamlit。 - 使用Streamlit运行应用程序:
streamlit run histogram_app.py。
这个Streamlit应用程序将显示一个随机生成的数据直方图。用户可以使用滑块与应用程序进行交互,以调整直方图中的箱子数量。根据用户的输入,直方图会自动更新。
运行结果如下:

代码
https://github.com/zgpeace/pets-name-langchain/tree/develop
参考
https://blog.streamlit.io/take-your-streamlit-apps-to-the-next-level-with-gpt-4/