2023年最新prometheus + grafana搭建和使用+gmail邮箱告警配置
一、安装prometheus
1.1 安装
prometheus官网下载地址
sudo -i
mkdir -p /opt/prometheus
#移动解压后的文件名到/opt/,并改名prometheus
mv prometheus-2.45 /opt/prometheus/
#创建一个专门的prometheus用户: -M 不创建家目录, -s 不让登录
useradd -M -s /usr/sbin/nologin prometheus

##更改prometheus用户的文件夹权限:
chown prometheus:prometheus -R /opt/prometheus
1.2 修改配置
global:
  scrape_interval: 30s # Set the scrape interval to every 15 seconds. Default is every 1 minute.
  evaluation_interval: 30s # Evaluate rules every 15 seconds. The default is every 1 minute.

# 其他全局配置...

scrape_configs:
  # Prometheus 自身的监控配置
  - job_name: "prometheus"
    static_configs:
      - targets: ["localhost:9070"]

  - job_name: 'node_widgets'
    scheme: https  # 使用 HTTPS
    tls_config:
      insecure_skip_verify: true  # 忽略证书验证
    static_configs:
      - targets: ['xxxxx.xxx.com:443']  # 替换为您的服务器 B 地址和端口
    metrics_path: '/prometheus/metrics'  # Node Exporter 的路径
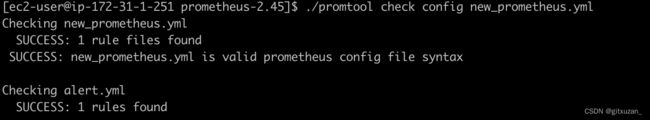
如果修改了配置可以验证配置
./promtool check config new_prometheus.yml
热更新
curl -X POST http://localhost:9070/-/reload
1.3 配置自启动
vim /etc/systemd/system/prometheus.service
写入数据
[Unit]
Description=Prometheus Server
After=network-online.target
[Service]
Type=simple
User=prometheus
Group=prometheus
Restart=on-failure
WorkingDirectory=/opt/prometheus/prometheus-2.45
ExecStart=/opt/prometheus/prometheus-2.45/prometheus --web.listen-address ":9070" --config.file /opt/prometheus/prometheus-2.45/new_prometheus.yml --storage.tsdb.path /opt/prometheus/prometheus-2.45/data --storage.tsdb.retention.time=20d --web.enable-lifecycle
[Install]
WantedBy=multi-user.target
开机自启动
sudo systemctl daemon-reload
sudo systemctl enable prometheus
sudo systemctl restart prometheus
sudo systemctl status prometheus
二、安装node_exporter
2.1 官网下载地址 https://prometheus.io/download/
2.2 开机自启动
添加
sudo vim /etc/systemd/system/node_exproter.service
[Unit]
Description=node_exporter
Documentation=https://prometheus.io/
After=network.target
[Service]
User=ubuntu
Group=ubuntu
ExecStart=/opt/prometheus/node_exproter-1.7.0/node_exporter --web.listen-address=":9101"
Restart=on-failure
[Install]
WantedBy=multi-user.target
sudo systemctl daemon-reload
sudo systemctl enable node_exproter
sudo systemctl restart node_exproter
sudo systemctl status node_exproter
三、安装grafana
3.1 官网下载地址 https://grafana.com/grafana/download?edition=oss&platform=linux
3.2 添加开机启动
添加service
sudo vim /etc/systemd/system/grafana.service
[Unit]
Description=Grafana server
Documentation=http://docs.grafana.org
[Service]
Type=simple
User=prometheus
Group=prometheus
Restart=on-failure
ExecStart=/opt/prometheus/grafana-v10.2.2/bin/grafana-server \
  --config=/opt/prometheus/grafana-v10.2.2/conf/grafana.ini \
  --homepath=/opt/prometheus/grafana-v10.2.2 \
  --http-port=3000
[Install]
WantedBy=multi-user.target
3.2 修改 grafana.init 邮箱配置
[smtp]
enabled = true
host = smtp.gmail.com:587
user = [email protected]
# If the password contains # or ; you have to wrap it with triple quotes. Ex """#password;"""
password = 授权码
cert_file =
key_file =
skip_verify = true
from_address = [email protected]
from_name = Grafana
ehlo_identity =
startTLS_policy =
sudo systemctl daemon-reload
sudo systemctl enable grafana
sudo systemctl restart grafana
sudo systemctl status grafana
四、alertmanager 安装
4.1 安装官网地址 https://prometheus.io/download/
4.2 新增启动项
编辑
sudo vim /etc/systemd/system/alertmanager.service
[Unit]
Description=Alert Manager
Wants=network-online.target
After=network-online.target

[Service]
Type=simple
User=prometheus
Group=prometheus
ExecStart=/opt/prometheus/alertmanager-0.26.0/alertmanager \
  --config.file=/opt/prometheus/alertmanager-0.26.0/alertmanager.yml \
  --storage.path=/opt/prometheus/alertmanager-0.26.0/data \
  --web.listen-address=:9071 \
  --cluster.listen-address=:9072

Restart=always

[Install]
WantedBy=multi-user.target
sudo systemctl daemon-reload
sudo systemctl enable alertmanager
sudo systemctl restart alertmanager
sudo systemctl status alertmanager -l
4.3 使用了prometheus 需要修改 new_prometheus.yml
新增
# Alertmanager configuration
alerting:
  alertmanagers:
    - static_configs:
        - targets:
            - alertmanager:9071

# Load rules once and periodically evaluate them according to the global 'evaluation_interval'.
rule_files:
  - "alert.yml"
在项目更目录下新增 新增alert.yml
groups:
- name: Prometheus alert
  rules:
  # 对任何实例超过30s无法联系的情况发出警报
  - alert: 服务告警
    expr: up == 0
    for: 30s
    labels:
      severity: critical
    annotations:
      instance: "{{ $labels.instance }}"
      description: "{{ $labels.job }} 服务已关闭"
具体告警规则:

alert: 这是告警的名称,在这个例子中命名为 "服务告警"。
expr: 这是触发告警的表达式。在这个例子中,表达式 up == 0 检查 up 指标是否等于 0。up 指标是 Prometheus 用来表示目标实例可达性的标准指标,其中 0 表示不可达,1 表示可达。
for: 这个条件指定了在触发告警之前必须满足告警条件的持续时间。在这里设置为 30s,意味着只有当 up 指标持续为 0 超过 30 秒时,才会触发告警。
labels: 这部分定义了附加到告警上的标签。在这个例子中,它设置了一个严重性标签(severity: critical),表示这是一个严重的告警。
annotations:
这部分提供了关于告警的更多信息,通常用于在告警通知中显示。在这个例子中,它包括两个注解:
instance: "{{ $labels.instance }}":这将显示触发告警的实例。
description: "{{ $labels.job }} 服务已关闭":这提供了一个描述性的消息,指出哪个服务(job)已经关闭。
4.4 验证配置
./promtool check config new_prometheus.yml
重新热加载配置
curl -X POST http://localhost:9070/-/reload
五、grafana 添加数据源
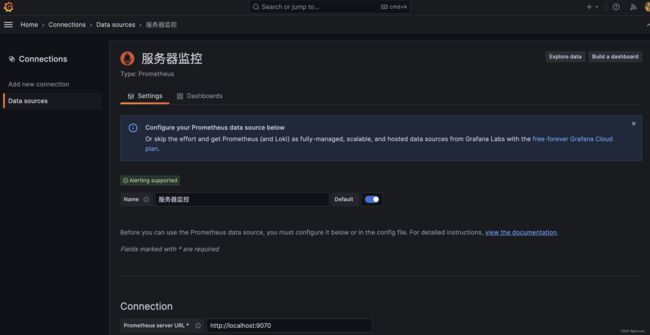
5.1 添加数据来源
这里填写prometheus 的数据源地址,因为grafana 和 prometheus 放到一台服务器上了,所以我填写的是localhost
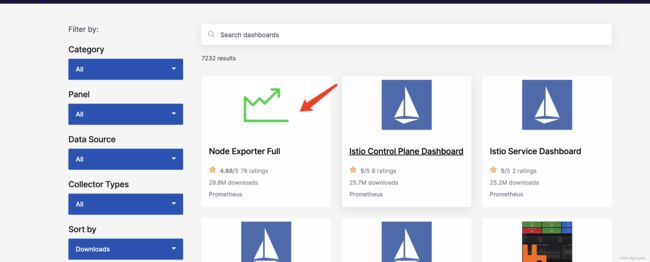
5.2 添加dashboards,添加地址: https://grafana.com/grafana/dashboards/
选择一个dashborads
copy dashborads 的ID
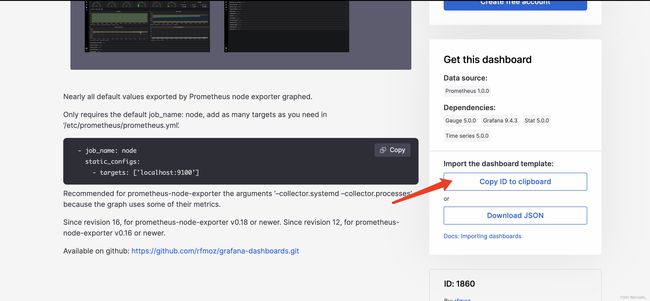
在grafana 界面导入dashborad ,可以通过ID导入
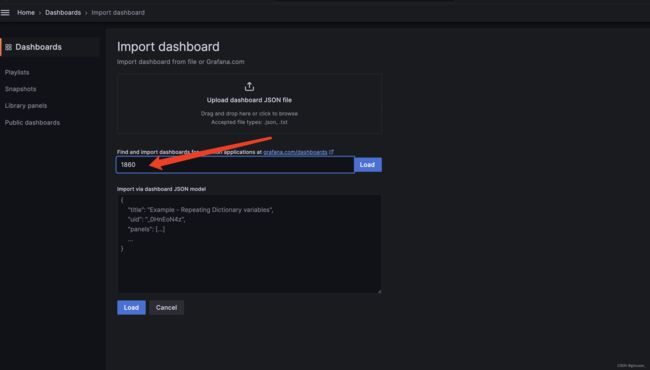
最后选择刚刚的数据源
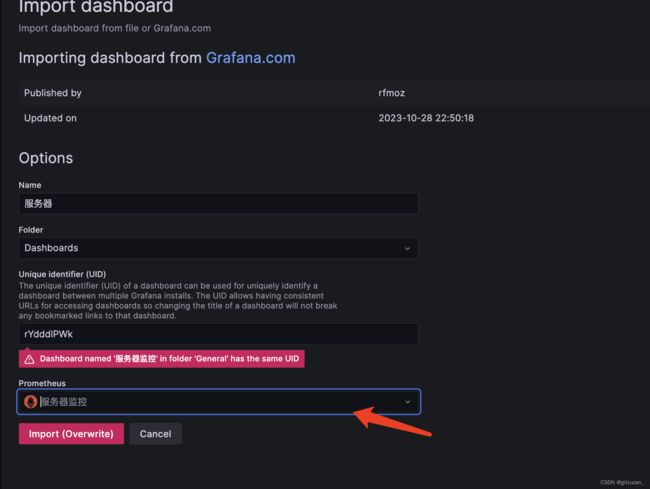
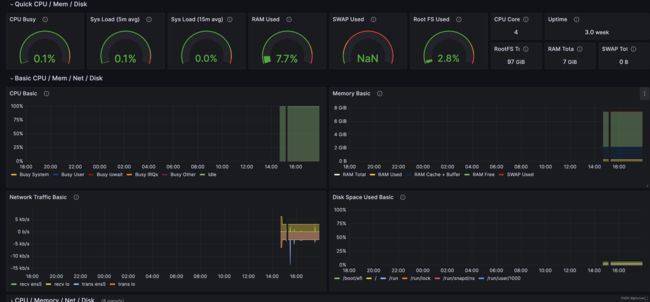
最终显示
六、配置gmail告警
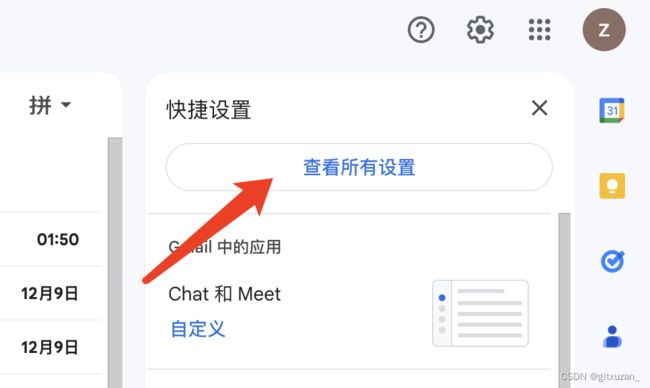
6.1 打开gmail 配置
![]()
点击查看所有配置
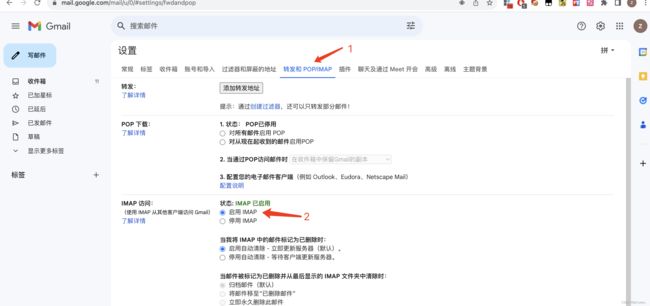
最后保存
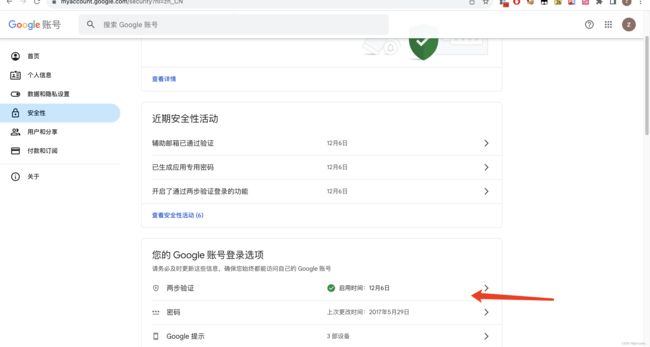
6.2 还需要打开二次验证生成授权码
打开专用密码
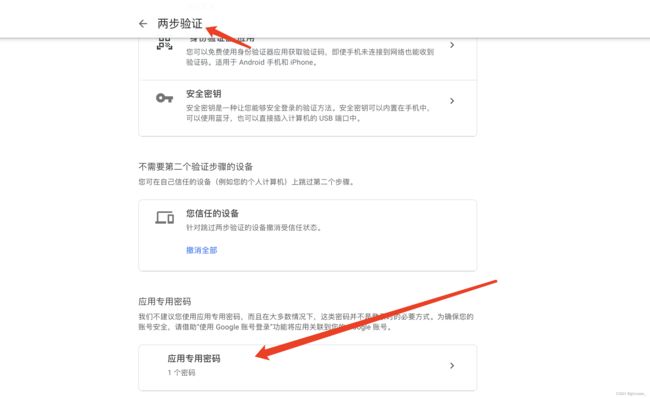
创建一个自定义名称的应用,这个授权码,就是发送邮箱设置的密码,会随机生成一段字符串
七、通过alertmanager 配置邮箱告警
7.1 alertmanager.yml配置
global:
  # 全局配置
  smtp_smarthost: 'smtp.gmail.com:587'  # 指定SMTP服务器和端口,这里使用的是Gmail的SMTP服务器和587端口
  smtp_from: '[email protected]'          # 发送告警邮件时使用的发件人邮箱地址
  smtp_auth_username: '[email protected]' # SMTP认证时使用的用户名,这里是邮箱地址
  smtp_auth_password: '二次认证上面生成auth密码' # SMTP认证时使用的密码

route:
  # 路由配置
  group_by: ['critical','warning']   # 告警分组依据,这里按照 'server_alert' 标签分组
  group_wait: 30s              # 分组后等待30秒,如果这段时间内有新的相同分组的告警则一起发送
  group_interval: 5m           # 分组告警发送间隔,即每5分钟发送一次同一组的告警
  repeat_interval: 1h          # 重复告警发送间隔,即相同的告警每小时重复发送一次
  receiver: 'email-notifications' # 默认接收器,用于处理没有匹配特定路由的告警
  routes:
    - match:
        severity: 'warning'     # 匹配规则,当告警级别为warning时
      receiver: 'email-notifications' # 使用此接收器处理告警
      group_by: ['warning']     # 告警分组依据,这里按照 'warning' 标签分组
    - match:
        severity: 'critical'    # 匹配规则,当告警级别为critical时
      receiver: 'email-notifications' # 使用此接收器处理告警
      group_by: ['critical']    # 告警分组依据,这里按照 'critical' 标签分组
	  group_wait: 10s           # 分组后等待10秒,如果这段时间内有新的相同分组的告警则一起发送
receivers:
  # 接收器定义
  - name: 'email-notifications'     # 接收器名称
    email_configs:
      - to: '[email protected]'       # 告警接收的邮箱地址
        send_resolved: true         # 告警解决后是否发送通知
7.2 prometheus.yml 修改
global:
  scrape_interval: 30s # Set the scrape interval to every 15 seconds. Default is every 1 minute.
  evaluation_interval: 30s # Evaluate rules every 15 seconds. The default is every 1 minute.

# 其他全局配置...

scrape_configs:
  # Prometheus 自身的监控配置
  - job_name: "prometheus"
    static_configs:
      - targets: ["localhost:9070"]

  - job_name: 'node_widgets'
    scheme: https  # 使用 HTTPS
    tls_config:
      insecure_skip_verify: true  # 忽略证书验证
    static_configs:
      - targets: ['xxx:443']  # 替换为您的服务器 B 地址和端口
    metrics_path: '/prometheus/metrics'  # Node Exporter 的路径

  - job_name: '正式服'
    scheme: https  # 使用 HTTPS
    tls_config:
      insecure_skip_verify: true  # 忽略证书验证
    static_configs:
      - targets: ['xxx.com:443']  # 替换为您的服务器 B 地址和端口
    metrics_path: '/v1/app/metrics'  # Node Exporter 的路径

  - job_name: '测式服'
    scheme: http  # 使用 HTTPS
    static_configs:
      - targets: ['23.8323.373.2437:8063']  # 替换为您的服务器 B 地址和端口
    metrics_path: '/v1/app/metrics'  # Node Exporter 的路径

# Alertmanager configuration
alerting:
  alertmanagers:
    - static_configs:
        - targets:
            - localhost:9071

# Load rules once and periodically evaluate them according to the global 'evaluation_interval'.
rule_files:
  - "alert.yml"
    # 测试的
    #- "test_alert.yml"
7.3 报警配置
alert.yml 配置服务是否down机,内存,cpu和 磁盘使用告警
groups:
  - name: Prometheus alert
    rules:
      # 对任何实例超过30s无法联系的情况发出警报
      - alert: 服务是否down机
        expr: up == 0
        for: 30s
        labels:
          severity: critical
        annotations:
          instance: "{{ $labels.instance }}"
          description: "{{ $labels.job }} 服务down机了,紧急查看"

      # 内存使用率超过 80% 的告警
      - alert: 内存使用情况
        expr: (node_memory_MemTotal_bytes - node_memory_MemAvailable_bytes) / node_memory_MemTotal_bytes * 100 > 80
        for: 30s
        labels:
          severity: warning
        annotations:
          instance: "{{ $labels.instance }}"
          description: "内存使用率超过 80%,当前值:{{ $value }}%"

      # CPU 使用率超过 80% 的告警
      - alert: cpu使用情况
        expr: 100 - (avg by (instance) (irate(node_cpu_seconds_total{mode="idle"}[5m])) * 100) > 80
        for: 30s
        labels:
          severity: critical
        annotations:
          instance: "{{ $labels.instance }}"
          description: "CPU 使用率超过 80%,当前值:{{ $value }}%"

      # 磁盘使用率超过 80% 的告警
      - alert: 磁盘使用情况
        expr: (node_filesystem_size_bytes - node_filesystem_free_bytes) / node_filesystem_size_bytes * 100 > 80
        for: 30s
        labels:
          severity: warning
        annotations:
          instance: "{{ $labels.instance }}"
          description: "磁盘使用率超过 80%,当前值:{{ $value }}%"

#  - name: myapp_alerts_down
#    rules:
#      - alert: 程序挂掉了(紧急查看)
#        expr: myapp_up == 1
#        for: 30s
#        labels:
#          severity: warning
#        annotations:
#          summary: "程序掉了 down,超过了30s了"
#          description: "instance {{ $labels.instance }} with job {{ $labels.job }}"
7.4 测试报警 test.alert
groups:
  - name: test_alerts
    rules:
      - alert: TestAlert
        expr: vector(1)
        labels:
          severity: warning
7.5 告警模版也可以自定义,下面这个是官方的模版
https://raw.githubusercontent.com/prometheus/alertmanager/master/template/email.html
DOCTYPE html PUBLIC "-//W3C//DTD XHTML 1.0 Transitional//EN" "http://www.w3.org/TR/xhtml1/DTD/xhtml1-transitional.dtd">
<html xmlns="http://www.w3.org/1999/xhtml">
<head>
<meta name="viewport" content="width=device-width" />
<meta http-equiv="Content-Type" content="text/html; charset=UTF-8" />
<title>{{ template "__subject" . }}title>
<style>
/* -------------------------------------
    GLOBAL
    A very basic CSS reset
------------------------------------- */
* {
  margin: 0;
  font-family: "Helvetica Neue", Helvetica, Arial, sans-serif;
  box-sizing: border-box;
  font-size: 14px;
}

img {
  max-width: 100%;
}

body {
  -webkit-font-smoothing: antialiased;
  -webkit-text-size-adjust: none;
  width: 100% !important;
  height: 100%;
  line-height: 1.6em;
  /* 1.6em * 14px = 22.4px, use px to get airier line-height also in Thunderbird, and Yahoo!, Outlook.com, AOL webmail clients */
  /*line-height: 22px;*/
}

/* Let's make sure all tables have defaults */
table td {
  vertical-align: top;
}

/* -------------------------------------
    BODY & CONTAINER
------------------------------------- */
body {
  background-color: #f6f6f6;
}

.body-wrap {
  background-color: #f6f6f6;
  width: 100%;
}

.container {
  display: block !important;
  max-width: 600px !important;
  margin: 0 auto !important;
  /* makes it centered */
  clear: both !important;
}

.content {
  max-width: 600px;
  margin: 0 auto;
  display: block;
  padding: 20px;
}

/* -------------------------------------
    HEADER, FOOTER, MAIN
------------------------------------- */
.main {
  background-color: #fff;
  border: 1px solid #e9e9e9;
  border-radius: 3px;
}

.content-wrap {
  padding: 30px;
}

.content-block {
  padding: 0 0 20px;
}

.header {
  width: 100%;
  margin-bottom: 20px;
}

.footer {
  width: 100%;
  clear: both;
  color: #999;
  padding: 20px;
}
.footer p, .footer a, .footer td {
  color: #999;
  font-size: 12px;
}

/* -------------------------------------
    TYPOGRAPHY
------------------------------------- */
h1, h2, h3 {
  font-family: "Helvetica Neue", Helvetica, Arial, "Lucida Grande", sans-serif;
  color: #000;
  margin: 40px 0 0;
  line-height: 1.2em;
  font-weight: 400;
}

h1 {
  font-size: 32px;
  font-weight: 500;
  /* 1.2em * 32px = 38.4px, use px to get airier line-height also in Thunderbird, and Yahoo!, Outlook.com, AOL webmail clients */
  /*line-height: 38px;*/
}

h2 {
  font-size: 24px;
  /* 1.2em * 24px = 28.8px, use px to get airier line-height also in Thunderbird, and Yahoo!, Outlook.com, AOL webmail clients */
  /*line-height: 29px;*/
}

h3 {
  font-size: 18px;
  /* 1.2em * 18px = 21.6px, use px to get airier line-height also in Thunderbird, and Yahoo!, Outlook.com, AOL webmail clients */
  /*line-height: 22px;*/
}

h4 {
  font-size: 14px;
  font-weight: 600;
}

p, ul, ol {
  margin-bottom: 10px;
  font-weight: normal;
}
p li, ul li, ol li {
  margin-left: 5px;
  list-style-position: inside;
}

/* -------------------------------------
    LINKS & BUTTONS
------------------------------------- */
a {
  color: #348eda;
  text-decoration: underline;
}

.btn-primary {
  text-decoration: none;
  color: #FFF;
  background-color: #348eda;
  border: solid #348eda;
  border-width: 10px 20px;
  line-height: 2em;
  /* 2em * 14px = 28px, use px to get airier line-height also in Thunderbird, and Yahoo!, Outlook.com, AOL webmail clients */
  /*line-height: 28px;*/
  font-weight: bold;
  text-align: center;
  cursor: pointer;
  display: inline-block;
  border-radius: 5px;
  text-transform: capitalize;
}

/* -------------------------------------
    OTHER STYLES THAT MIGHT BE USEFUL
------------------------------------- */
.last {
  margin-bottom: 0;
}

.first {
  margin-top: 0;
}

.aligncenter {
  text-align: center;
}

.alignright {
  text-align: right;
}

.alignleft {
  text-align: left;
}

.clear {
  clear: both;
}

/* -------------------------------------
    ALERTS
    Change the class depending on warning email, good email or bad email
------------------------------------- */
.alert {
  font-size: 16px;
  color: #fff;
  font-weight: 500;
  padding: 20px;
  text-align: center;
  border-radius: 3px 3px 0 0;
}
.alert a {
  color: #fff;
  text-decoration: none;
  font-weight: 500;
  font-size: 16px;
}
.alert.alert-warning {
  background-color: #E6522C;
}
.alert.alert-bad {
  background-color: #D0021B;
}
.alert.alert-good {
  background-color: #68B90F;
}

/* -------------------------------------
    INVOICE
    Styles for the billing table
------------------------------------- */
.invoice {
  margin: 40px auto;
  text-align: left;
  width: 80%;
}
.invoice td {
  padding: 5px 0;
}
.invoice .invoice-items {
  width: 100%;
}
.invoice .invoice-items td {
  border-top: #eee 1px solid;
}
.invoice .invoice-items .total td {
  border-top: 2px solid #333;
  border-bottom: 2px solid #333;
  font-weight: 700;
}

/* -------------------------------------
    RESPONSIVE AND MOBILE FRIENDLY STYLES
------------------------------------- */
@media only screen and (max-width: 640px) {
  body {
    padding: 0 !important;
  }

  h1, h2, h3, h4 {
    font-weight: 800 !important;
    margin: 20px 0 5px !important;
  }

  h1 {
    font-size: 22px !important;
  }

  h2 {
    font-size: 18px !important;
  }

  h3 {
    font-size: 16px !important;
  }

  .container {
    padding: 0 !important;
    width: 100% !important;
  }

  .content {
    padding: 0 !important;
  }

  .content-wrap {
    padding: 10px !important;
  }

  .invoice {
    width: 100% !important;
  }
}
style>
head>

<body itemscope itemtype="https://schema.org/EmailMessage">

<table class="body-wrap">
  <tr>
    <td>td>
    <td class="container" width="600">
      <div class="content">
        <table class="main" width="100%" cellpadding="0" cellspacing="0">
          <tr>
            {{ if gt (len .Alerts.Firing) 0 }}
            <td class="alert alert-warning">
              {{ .Alerts | len }} alert{{ if gt (len .Alerts) 1 }}s{{ end }} for {{ range .GroupLabels.SortedPairs }}
                {{ .Name }}={{ .Value }}
              {{ end }}
            td>
            {{ else }}
            <td class="alert alert-good">
              {{ .Alerts | len }} alert{{ if gt (len .Alerts) 1 }}s{{ end }} for {{ range .GroupLabels.SortedPairs }}
                {{ .Name }}={{ .Value }}
              {{ end }}
            td>
            {{ end }}
          tr>
          <tr>
            <td class="content-wrap">
              <table width="100%" cellpadding="0" cellspacing="0">
                <tr>
                  <td class="content-block">
                    <a href='{{ template "__alertmanagerURL" . }}' class="btn-primary">View in {{ template "__alertmanager" . }}a>
                  td>
                tr>
                {{ if gt (len .Alerts.Firing) 0 }}
                <tr>
                  <td class="content-block">
                    <strong>[{{ .Alerts.Firing | len }}] Firingstrong>
                  td>
                tr>
                {{ end }}
                {{ range .Alerts.Firing }}
                <tr>
                  <td class="content-block">
                    <strong>Labelsstrong><br />
                    {{ range .Labels.SortedPairs }}{{ .Name }} = {{ .Value }}<br />{{ end }}
                    {{ if gt (len .Annotations) 0 }}<strong>Annotationsstrong><br />{{ end }}
                    {{ range .Annotations.SortedPairs }}{{ .Name }} = {{ .Value }}<br />{{ end }}
                    <a href="{{ .GeneratorURL }}">Sourcea><br />
                  td>
                tr>
                {{ end }}

                {{ if gt (len .Alerts.Resolved) 0 }}
                  {{ if gt (len .Alerts.Firing) 0 }}
                <tr>
                  <td class="content-block">
                    <br />
                    <hr />
                    <br />
                  td>
                tr>
                  {{ end }}
                <tr>
                  <td class="content-block">
                    <strong>[{{ .Alerts.Resolved | len }}] Resolvedstrong>
                  td>
                tr>
                {{ end }}
                {{ range .Alerts.Resolved }}
                <tr>
                  <td class="content-block">
                    <strong>Labelsstrong><br />
                    {{ range .Labels.SortedPairs }}{{ .Name }} = {{ .Value }}<br />{{ end }}
                    {{ if gt (len .Annotations) 0 }}<strong>Annotationsstrong><br />{{ end }}
                    {{ range .Annotations.SortedPairs }}{{ .Name }} = {{ .Value }}<br />{{ end }}
                    <a href="{{ .GeneratorURL }}">Sourcea><br />
                  td>
                tr>
                {{ end }}
              table>
            td>
          tr>
        table>

        <div class="footer">
          <table width="100%">
            <tr>
              <td class="aligncenter content-block"><a href='{{ .ExternalURL }}'>Sent by {{ template "__alertmanager" . }}a>td>
            tr>
          table>
        div>div>
    td>
    <td>td>
  tr>
table>

body>
html>
八、alertmanger 的webhook配置
8.1 alert_news.yml
下面的匹配主要会通过match 匹配报警的 label
route:
  # 路由配置
  group_by: ['critical','warning']   # 告警分组依据,这里按照 'server_alert' 标签分组
  group_wait: 30s              # 分组后等待30秒,如果这段时间内有新的相同分组的告警则一起发送
  group_interval: 5m           # 分组告警发送间隔,即每5分钟发送一次同一组的告警
  repeat_interval: 1h          # 重复告警发送间隔,即相同的告警每小时重复发送一次
  receiver: 'email-notifications' # 默认接收器,用于处理没有匹配特定路由的告警
  routes:
    - match:
        severity: 'warning'     # 匹配规则,当告警级别为warning时
      receiver: 'email-notifications' # 使用此接收器处理告警
      group_by: ['warning']     # 告警分组依据,这里按照 'warning' 标签分组
      continue: true  # 允许告警继续匹配后续路由
    - match:
        webhook: 'server'
      receiver: 'webhook-server-restart'
      group_by: [ 'server_restart' ] # 这里按 job 和 instance 分组
      group_wait: 0s           # 分组后等待10秒,如果这段时间内有新的相同分组的告警则一起发送
      group_interval: 2m           # 分组告警发送间隔,即每5分钟发送一次同一组的告警
      repeat_interval: 1h          # 重复告警发送间隔,即相同的告警每小时重复发送一次
      continue: true  # 允许告警继续匹配后续路由
    - match:
        severity: 'critical'    # 匹配规则,当告警级别为critical时
      receiver: 'email-notifications' # 使用此接收器处理告警
      group_by: ['critical']    # 告警分组依据,这里按照 'critical' 标签分组
      group_wait: 4s           # 分组后等待10秒,如果这段时间内有新的相同分组的告警则一起发送
      continue: true  # 允许告警继续匹配后续路由
receivers:
  # 接收器定义
  - name: 'email-notifications'     # 接收器名称
    email_configs:
      - to: '[email protected]'       # 告警接收的邮箱地址
        send_resolved: true         # 告警解决后是否发送通知
  - name: 'webhook-server-restart'
    webhook_configs:
      - url: 'http://test.com'  # 替换为你的webhook URL
        send_resolved: false
webhook 发送的内容是个post请求,可以通过job去区分做点自动化的事情
{
    "receiver": "webhook-server-restart",
    "status": "firing",
    "alerts": [
        {
            "status": "firing",
            "labels": {
                "alertname": "服务是否down机",
                "instance": "127.0.0.1:8030",
                "job": "widgets测试用的8030",
                "severity": "critical",
                "webhook": "server"
            },
            "annotations": {
                "description": "widgets测试用的8030 服务down机了,紧急查看",
                "instance": "127.0.0.1:8030"
            },
            "startsAt": "2023-12-12T05:33:45.995Z",
            "endsAt": "0001-01-01T00:00:00Z",
            "generatorURL": "http://ip-172-31-1-251.ec2.internal:9070/graph?g0.expr=up+%3D%3D+0&g0.tab=1",
            "fingerprint": "e42bc9ee6cfe5567"
        }
    ],
    "groupLabels": {},
    "commonLabels": {
        "alertname": "服务是否down机",
        "instance": "127.0.0.1:8030",
        "job": "widgets测试用的8030",
        "severity": "critical",
        "webhook": "server"
    },
    "commonAnnotations": {
        "description": "widgets测试用的8030 服务down机了,紧急查看",
        "instance": "127.0.0.1:8030"
    },
    "externalURL": "http://ip-172-31-1-251.ec2.internal:9071",
    "version": "4",
    "groupKey": "{}/{webhook=\"server\"}:{}",
    "truncatedAlerts": 0
}
8.2 关于amtool 使用
检测配置和查看当前警报
./amtool check-config new_alertmanager.yml

./amtool --alertmanager.url=http://localhost:9071 alert