(三十九)大数据实战——Prometheus监控平台的部署搭建
前言
Prometheus监控(Prometheus Monitoring)是一种开源的系统监控和警报工具。它最初由SoundCloud开发并于2012年发布,并在2016年加入了云原生计算基金会(CNCF)。Prometheus监控旨在收集、存储和查询各种指标数据,以帮助用户监视其应用程序和系统的性能和运行状态。
Prometheus是一个开源的完整监控解决方案,其对传统监控系统的测试和告警模型进行了彻底的颠覆,形成了基于中央化的规则计算、统一分析和告警的新模型。 相比于传统监控系统,Prometheus使用一种称为PromQL的查询语言,可以对收集到的指标数据进行灵活的查询和分析。它支持多种数据展示和可视化方式,如图表、仪表盘和警报规则等,以帮助用户更好地理解和分析监控数据。Prometheus还具有可扩展性和弹性,可以适应不同规模和复杂度的环境。它可以与其他工具和系统集成,如Grafana、Alertmanager和Kubernetes等,以构建完整的监控和告警解决方案。
正文
①下载Prometheus组件安装包,将下载好的Prometheus安装包上传的centos服务上
地址:Download | Prometheus

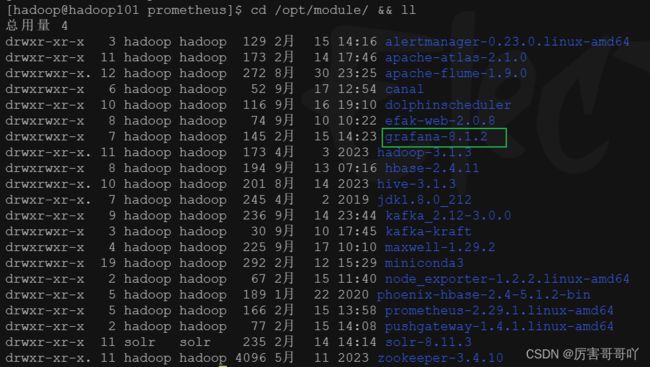
②解压prometheus-2.29.1.linux-amd64.tar.gz安装包到/opt/module目录下
命令:
tar -zxvf prometheus-2.29.1.linux-amd64.tar.gz -C /opt/module/
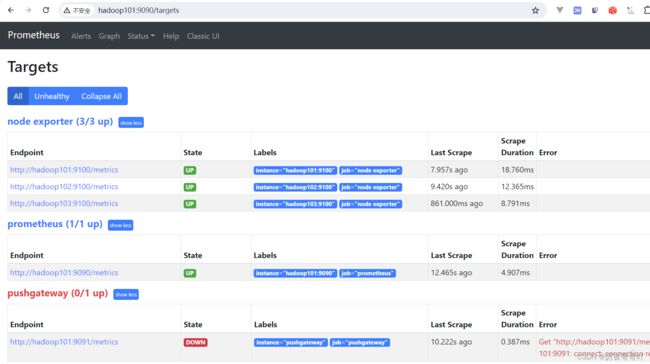
③ 修改Prometheus的配置文件prometheus.yml文件,添加pushgateway和node_exporter的监控任务
# A scrape configuration containing exactly one endpoint to scrape:
# Here it's Prometheus itself.
scrape_configs:
  # The job name is added as a label `job=` to any timeseries scraped from this config.
  - job_name: "prometheus"

    # metrics_path defaults to '/metrics'
    # scheme defaults to 'http'.

    static_configs:
      - targets: ["hadoop101:9090"]

  # 添加PushGateway监控配置
  - job_name: 'pushgateway'
    static_configs:
      - targets: ['hadoop101:9091']
        labels:
           instance: pushgateway

  # 添加Node Exporter监控配置
  - job_name: 'node exporter'
    static_configs:
- targets: ['hadoop101:9100', 'hadoop102:9100', 'hadoop103:9100'] 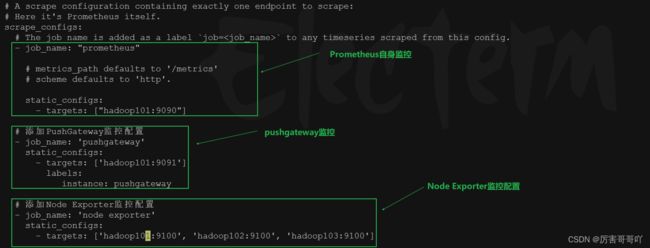
④ 安装PushGateway监控组件,将pushgateway-1.4.1.linux-amd64.tar.gz解压到/opt/module目录下
命令:
tar -zxvf pushgateway-1.4.1.linux-amd64.tar.gz -C /opt/module/
⑤安装AlertManager报警组件,将alertmanager-0.23.0.linux-amd64.tar.gz解压到/opt/module目录下
命令:
tar -zxvf alertmanager-0.23.0.linux-amd64.tar.gz -C /opt/module/
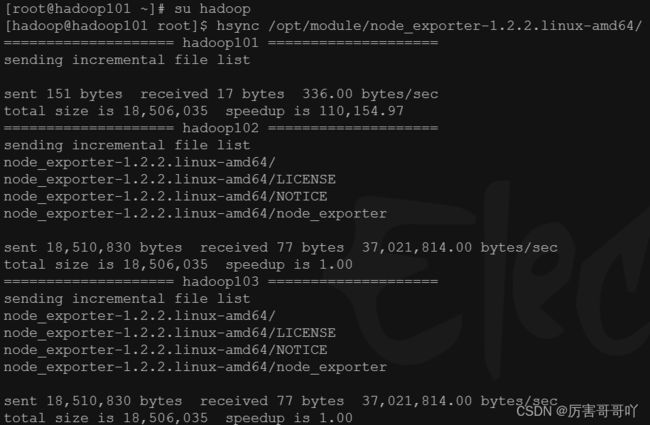
⑥安装NodeExporter监控组件,将node_exporter-1.2.2.linux-amd64.tar.gz解压到/opt/module目录下
命令:
tar -zxvf node_exporter-1.2.2.linux-amd64.tar.gz -C /opt/module
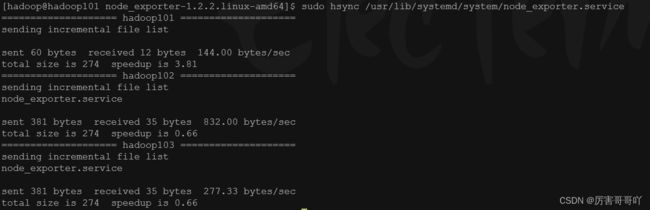
⑦ 分发NodeExporter监控组件安装包到其它服务器
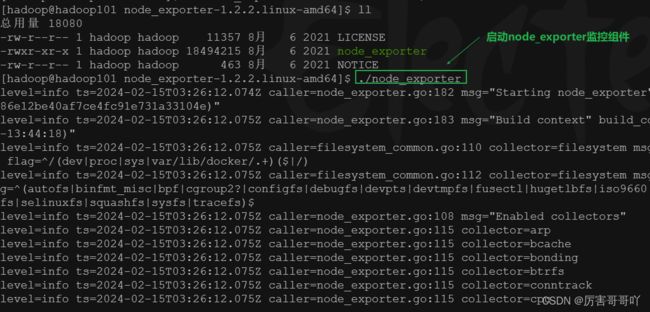
⑧在NodeExporter安装目录下,启动NodeExporter监控组件
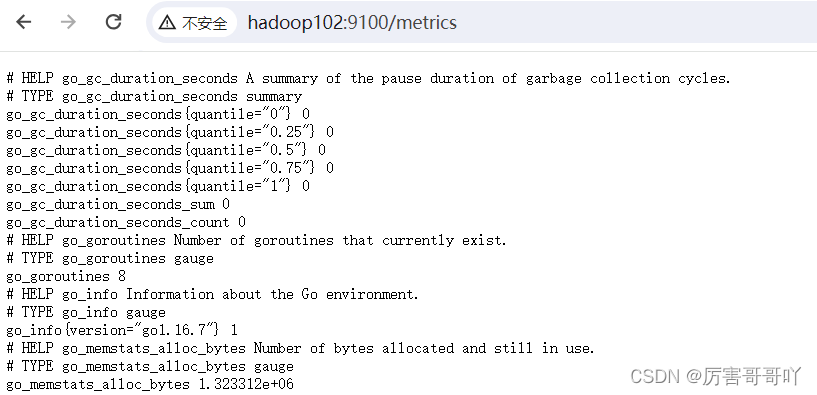
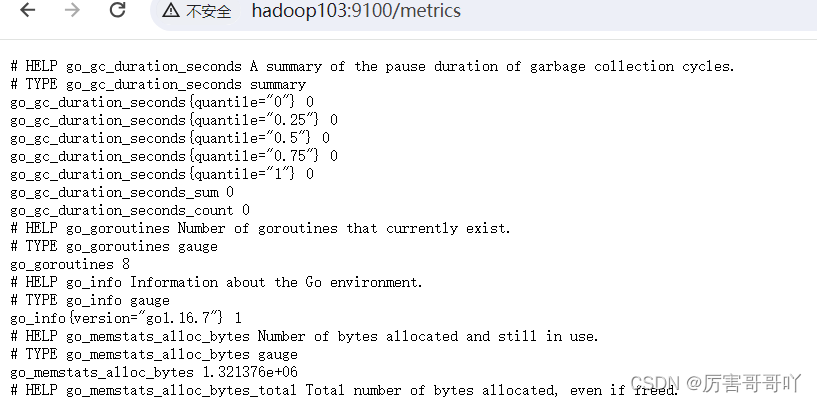
⑨访问NodeExporter监控地址,证明服务器监控指标已经能够获取到

⑩将NodeExporter安装成一个服务,便于启动
- 在/usr/lib/systemd/system目录下创建一个node_exporter.service服务文件
[Unit]
Description=node_export
Documentation=https://github.com/prometheus/node_exporter
After=network.target

[Service]
Type=simple
User=hadoop
ExecStart=/opt/module/node_exporter-1.2.2.linux-amd64/node_exporter
Restart=on-failure

[Install]
WantedBy=multi-user.target
- 分发node_exporter.service服务文件到其它服务器
- 通过服务方式启动NodeExporter,也可以设置为开机自启动
#设置为开机自启动
sudo systemctl enable node_exporter.service
#禁用开机自启动
sudo systemctl disable node_exporter.service
# 启动
sudo systemctl start node_exporter.service
# 查看状态
sudo systemctl status node_exporter.service
# 停止
sudo systemctl stop node_exporter.service


⑪进入Prometheus安装目录,启动Prometheus主服务
- 启动命令:
nohup ./prometheus --config.file=prometheus.yml > ./prometheus.log 2>&1 &
- 访问Prometheus主服务

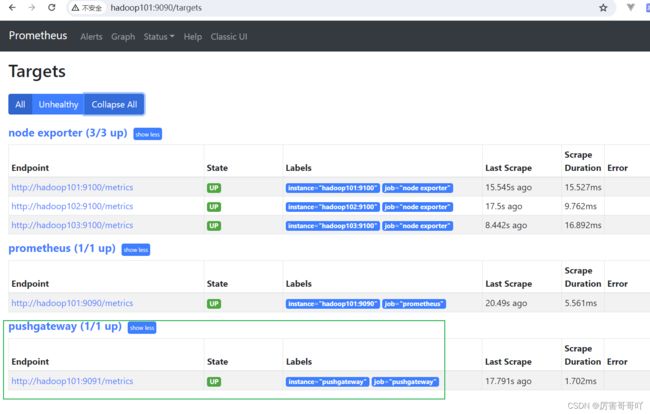
⑫进入PushGateway目录,启动PushGateway组件
- 启动命令:
nohup ./pushgateway --web.listen-address :9091 > ./pushgateway.log 2>&1 &
- 查看监控状态

⑬进入AlertManager目录,启动AlertManager组件
- 启动命令
nohup ./alertmanager --config.file=alertmanager.yml > ./alertmanager.log 2>&1 &

⑭安装grafana可视化工具
- 解压grafana-enterprise-8.1.2.linux-amd64.tar.gz安装包到/opt/module目录下
tar -zxvf grafana-enterprise-8.1.2.linux-amd64.tar.gz -C /opt/module
- 进入grafana安装目录,后台启动grafana服务
nohup ./bin/grafana-server web > ./grafana.log 2>&1 &
- 访问grafana的web服务,可使用默认账户admin和默认密码admin登录


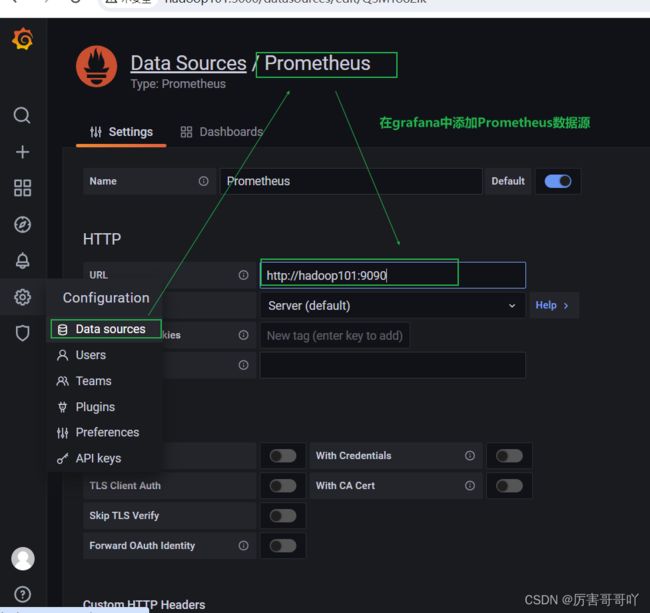
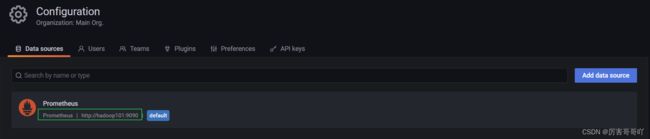
⑮登录granafa后,在grafana中添加Prometheus数据源
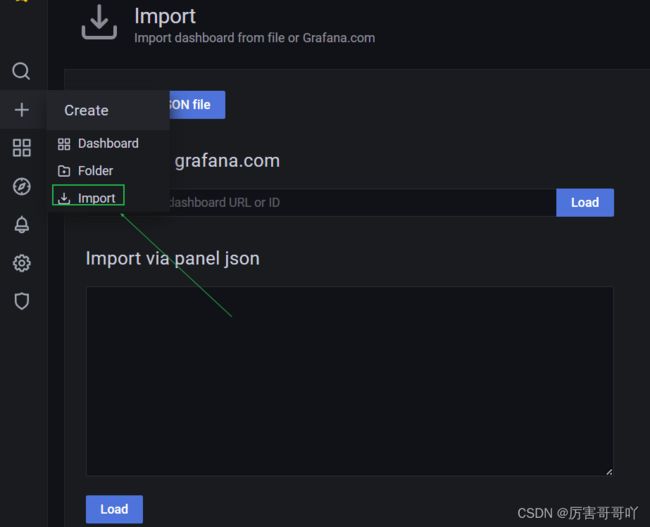
⑯在grafana中添加NodeExporter监控面板
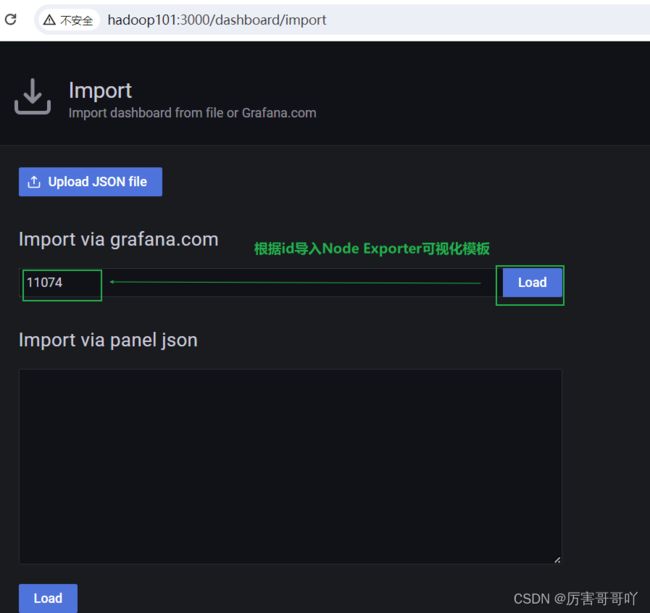
- 在grafana中选择import
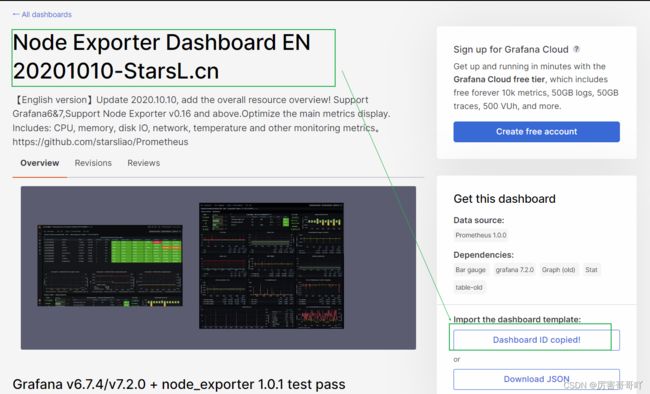
- 在grafana dashboard的组件库中下载一个node exporter的模板监控,Dashboards | Grafana Labs
- 根据id:11074导入Node Exporter监控模板
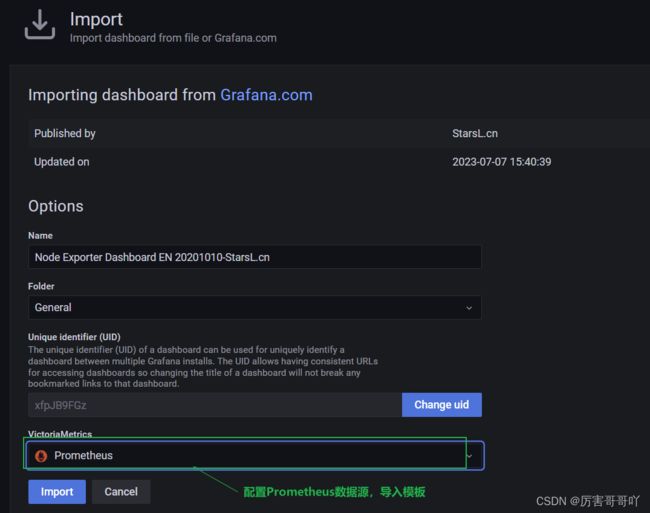
- 添加Prometheus数据源,点击导入
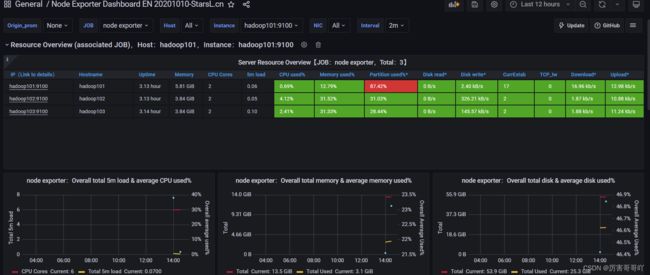
- 进入可视化监控页面,实现服务器的指标监控
⑰使用root用户在/usr/bin目录下创建一个组件的启停脚本my_prometheus.sh,包括Prometheus、PushGateway、grafana
#!/bin/bash
case $1 in
"start"){
	echo '---- 启动 prometheus ----'
	nohup /opt/module/prometheus-2.29.1.linux-amd64/prometheus --web.enable-admin-api --config.file=/opt/module/prometheus-2.29.1.linux-amd64/prometheus.yml > /opt/module/prometheus-2.29.1.linux-amd64/prometheus.log 2>&1 &
    echo '---- 启动 pushgateway ----'
    nohup /opt/module/pushgateway-1.4.1.linux-amd64/pushgateway --web.listen-address :9091 > /opt/module/pushgateway-1.4.1.linux-amd64/pushgateway.log 2>&1 &
    echo '---- 启动 grafana ----'
    nohup /opt/module/grafana-8.1.2/bin/grafana-server --homepath /opt/module/grafana-8.1.2 web > /opt/module/grafana-8.1.2/grafana.log 2>&1 &
};;
"stop"){
	echo '---- 停止 grafana ----'
	pgrep -f grafana | xargs kill
	echo '---- 停止 pushgateway ----'
	pgrep -f pushgateway | xargs kill
	echo '---- 停止 prometheus ----'
	pgrep -f prometheus | xargs kill
};;
esac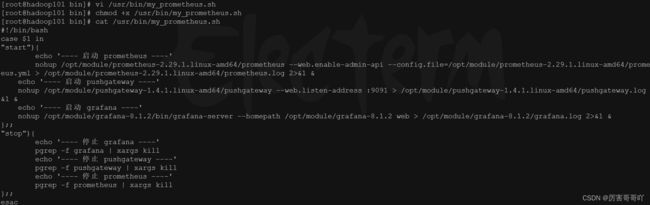
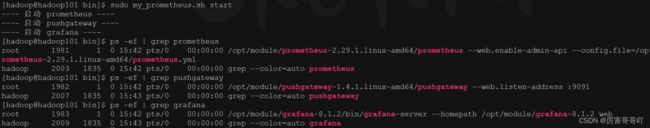
⑱启停Prometheus监控组件
- 启动Prometheus监控组件
- 停止Prometheus监控组件
结语
关于Prometheus监控平台部署搭建的内容到这里就结束了,我们下期见。。。。。。