antv/g6 绘制生态图-新手入门
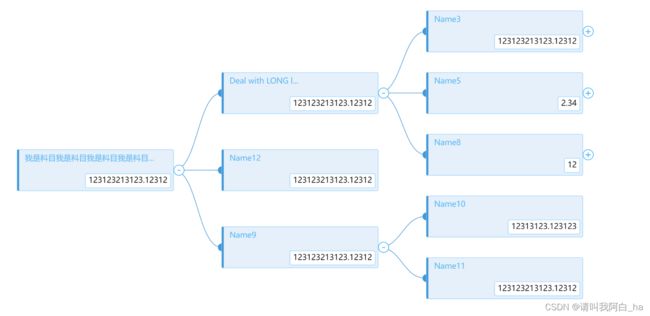
实现效果如下图:
API文档:图配置 G6.Graph(cfg) | G6
参考样例:自定义树图 | G6
坐标转换:坐标转换
一、安装 & 引用
1. 通过npm包引入
npm install --save @antv/g6在需要使用的文件中直接引入G6即可
import G6 from "@antv/g6"2. 通过CDN形式引入
// version <= 3.2


// version >= 3.3
二、数据结构如下:
const mockData = {
                id: 'g1',
                name: '我是科目我是科目我是科目我是科目我是科目我是科目目目目目',
                dataType: 'root',
                amount: 123123213123.123123,
                children: [
                    {
                        id: 'g12',
                        name: 'Deal with LONG label LONG label LONG label LONG label',
                        amount: 123123213123.123123,
                        children: [
                            {
                                id: 'g121',
                                name: 'Name3',
                                collapsed: true,
                                amount: 123123213123.123123,
                                children: [
                                    {
                                        id: 'g1211',
                                        name: 'Name4',
                                        amount: 123123213123.123123,
                                        children: [],
                                    },
                                ],
                            },
                            {
                                id: 'g122',
                                name: 'Name5',
                                collapsed: true,
                                amount: 2.34,
                                children: [
                                    {
                                        id: 'g1221',
                                        name: 'Name6',
                                        amount: 0.123123,
                                        children: [
                                            {
                                                id: 'g12211',
                                                name: 'Name6-1',
                                                amount: 123123,
                                                children: [],
                                            },
                                        ],
                                    },
                                    {
                                        id: 'g1222',
                                        name: 'Name7',
                                        amount: 123123213123.123123,
                                        children: [],
                                    },
                                ],
                            },
                            {
                                id: 'g123',
                                name: 'Name8',
                                collapsed: true,
                                amount: 12,
                                children: [
                                    {
                                        id: 'g1231',
                                        name: 'Name8-1',
                                        amount: 123123213123.123123,
                                        children: [],
                                    },
                                ],
                            },
                        ],
                    },
                    {
                        id: 'g13',
                        name: 'Name9',
                        amount: 123123213123.123123,
                        children: [
                            {
                                id: 'g131',
                                name: 'Name10',
                                amount: 12313123.123123,
                                children: [],
                            },
                            {
                                id: 'g132',
                                name: 'Name11',
                                amount: 123123213123.123123,
                                children: [],
                            },
                        ],
                    },
                    {
                        id: 'g14',
                        name: 'Name12',
                        amount: 123123213123.123123,
                        children: [],
                    },
                ],
            };
完整代码如下:
问题:
当我们按照以上操作绘制完图之后,发现画布中的内容并非居中展示,设置 fitView: true 并没有起作用,有可能是因为布局原因,有定位的设置可能会影响画布的中心坐标,有了解决问题的思路 ,我们就开始着手试试把。增加以下代码:
// 设置画布居中
setCenetr(graph) {
    const con_width = document.getElementById("container").clientWidth;
    const con_Height = document.getElementById("container").clientHeight;

    // 重新计算画布中心的坐标
    const centerX = con_width / 2 - 60;
    const centerY = con_Height / 2 - 60;
    // 以 x, y 为坐标中心,进行缩放
    graph.zoomTo(0.7, {
        x: centerX,
        y: centerY
    })
}
以上方法需在 graph.render() 之前执行。
友情提示:新手小白入门的话最好是先找个和自己需求相似案例看看,然后开始照猫画虎,画着画着慢慢就能就看明白了,当然 大佬略过哈 ~ 多看看官方的文档,写的很详细。