FusionCharts图表生成方式及实例-3D饼图
最近项目中报表数据的图表展示采用了FusionCharts,功能需求如下:
1.提供在线flash图表展示。
2.根据周期性报表的数据,生成静态html文件,提供用户订阅。
功能实现思路:
1.对于提供在线flash图表展示,主要参考了FusionCharts的文档示例,具体实现可见下面实例。注意一点:
因为生成xml文件会增加磁盘IO操作,会降低图表生成功能的整体性能,所以对于用户请求返回页面呈现chart的需求,采取不生成xml数据文件的方式。在default.jsp中包含PieData.jsp,由PieData.jsp生成数据流,在default.jsp中输出渲染为swf图表。
2.根据需求从DB中获取所需数据。
2.1生成data.xml数据文件.
2.2生成html文件,组装显示所需的文件,例如:FusionCharts.js,对应的swf等。
2.3生成需求规定的文件目录结构,将html及相关文件分别放到指定的位置。
由于FusionCharts的示例中太多的逻辑采用了jsp来获取或者生成,所以对它进行了简单的封装,目的是方便项目组其他人对FusionCharts的使用。
效果图:
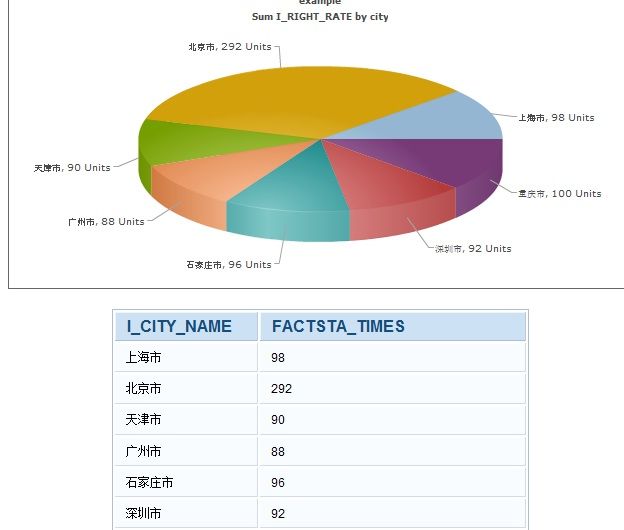
示例:
1.FusionCharts图表展示
采用了jsp中生成data.xml的方式。
default.jsp
<%@ page language="java" contentType="text/html; charset=UTF-8" pageEncoding="UTF-8"%>

<%@page import="org.apache.commons.logging.Log"%>
<%@page import="org.apache.commons.logging.LogFactory"%>

<%@page import="com.test.FusionChartUtil"%>
<%@page import="com.test.FusionChartsDTO"%>


<%
	String path = request.getContextPath();
	String basePath = request.getScheme()+"://"+request.getServerName()+":"+request.getServerPort()+path+"/";
%>

<%@ include file = "../Includes/FusionCharts.jsp" %>
<HTML>
<HEAD>
<TITLE>3D饼图</TITLE>
<link rel="stylesheet" type="text/css" href="<%=path%>/css/st/css.css" />
<link rel="stylesheet" type="text/css" href="<%=path%>/css/st/home.css" />

<SCRIPT LANGUAGE="Javascript" SRC="<%=basePath%>FusionCharts/FusionCharts.js"></SCRIPT>
<style type="text/css">
	<!--
	body {
		font-family: Arial, Helvetica, sans-serif;
		font-size: 12px;
	}
	.text{
		font-family: Arial, Helvetica, sans-serif;
		font-size: 12px;
	}
	-->
	</style>
</HEAD>
<BODY>
<CENTER>
<h2>查询表TAB_OMIN_ST_G_SDATAAREA_H</h2>
<%
	Log logger = LogFactory.getLog(getClass());

	String animate = (String)request.getAttribute("animate");

	String dataPath = path +"/jsp/st/bs/DB_dataURL/PieData.jsp?animate="+ animate;
	String swfPath = path +"/FusionCharts/Pie3D.swf";
	logger.info("^^^^^^^^^^^^^^^^^^^^^^^^^ dataPath = "+ dataPath);

	FusionChartsDTO fusionCharts = new FusionChartsDTO();
	fusionCharts.setStrDataURL(dataPath);
	fusionCharts.setAddNoCacheStr("false");
	fusionCharts.setResponse(response);
	fusionCharts.setSwfURL(swfPath);
	fusionCharts.setDataURL("dataPath");
	fusionCharts.setChartId("FactorySum");
	fusionCharts.setChartWidth(600);
	fusionCharts.setChartHeight(300);
	fusionCharts.setDebugMode(false);
	fusionCharts.setRegisterWithJS(false);

	String chartCode = FusionChartUtil.genChart(fusionCharts);

	out.print(chartCode);
	out.print("<p><p>");
	out.print((String)request.getAttribute("tableData"));
%>

<BR>
<BR>
</CENTER>
</BODY>
</HTML>
PieData.jsp
参考FusionCharts的jsp示例
<%@ page language="java" contentType="text/html; charset=UTF-8" pageEncoding="UTF-8"%>

<%
	String path = request.getContextPath();
	String basePath = request.getScheme()+"://"+request.getServerName()+":"+request.getServerPort()+path+"/";
%>

<%@ page import="java.io.*"%>
<%@ page import="com.test.PieChartXmlDataProvider"%>

<%
	String strXML="";

	//Default.jsp has passed us a property animate. We request that.
	String animateChart;
	animateChart = request.getParameter("animate");
	//Set default value of 1
	if(null==animateChart||animateChart.equals("")){
		animateChart = "1";
	}

	String strQuery = "select I_CITY_NAME,sum(I_FACTSTA_TIMES) as FACTSTA_TIMES from tab_omin_st_g_sdataarea_h group by I_CITY_NAME";
	strXML = new PieChartXmlDataProvider().getXmlData(animateChart,strQuery,"dataURL");
	//logger.info("^^^^^^^^^^^^^^^^^^^^^^^^^ pieData strXML = "+ strXML);

	//Set Proper output content-type
	//解决中文乱码问题
	response.setContentType( "text/xml; charset=UTF-8" );
	OutputStream outs = response.getOutputStream();

	outs.write( new byte[]{(byte)0xEF, (byte)0xBB, (byte)0xBF} );
	outs.write(strXML.getBytes("UTF-8"));
	outs.flush();
	outs.close();
	outs = null;

	response.flushBuffer();
	out.clear();
	out = pageContext.pushBody();
%>
PieChartXmlDataProvider.java
数据查询类,返回组装数据的<chart/>标签
public class PieChartXmlDataProvider extends AbsChartXmlDataProvider{
	private static Logger logger = Logger.getLogger(PieChartXmlDataProvider.class);


	public String getXmlData(String animateChart,String sql,String getDataType){
		String cityName = "";
		String rightRate = "";

		StringBuffer dataBuffer = new StringBuffer("");
		dataBuffer.append("<chart caption='example' subCaption='Sum I_RIGHT_RATE by city' pieSliceDepth='30' " +
				"showBorder='1' formatNumberScale='0' numberSuffix=' Units'");

		if(getDataType.equals(BsConstants.DATA_TYPE_DATA_URL)){
			dataBuffer.append("animation=' " + animateChart + "'>");
		}else if(getDataType.equals(BsConstants.DATA_TYPE_DATA_XML)){
			dataBuffer.append(">");
		}

		try{
			DAO dao = BF.getDAO();
			List<Map> rsList = dao.executeQuery(sql,"查询数据");
			for (Map map : rsList) {
				cityName = (String)map.get("I_CITY_NAME");
				rightRate = ((BigDecimal)map.get("FACTSTA_TIMES")).toString();
				//logger.info("^^^^^^^^^^^^^^^^^^^^^^^^^ cityName = "+ cityName);
				//logger.info("^^^^^^^^^^^^^^^^^^^^^^^^^ rightRate = "+ rightRate);

				dataBuffer.append("<set label='" + cityName + "' value='" +rightRate+ "' />");
			}
			dataBuffer.append("</chart>");
			logger.info("^^^^^^^^^^^^^^^^^^^^^^^^^ pieData strXML = "+ dataBuffer.toString());

		}catch (Exception e) {
		    e.printStackTrace();
		}

		return dataBuffer.toString();
	}

}
FusionChartUtil.java
生成html文件util类
import javax.servlet.http.HttpServletResponse;


public class FusionChartUtil {

	/**
	 * 生成FusionCharts图
	 * @param fusionCharts
	 * @return
	 */
	public static String genChart(FusionChartsDTO fusionCharts) {
		String strDataURL = fusionCharts.getStrDataURL() == null ? "" : fusionCharts.getStrDataURL();
		String addNoCacheStr = fusionCharts.getAddNoCacheStr() == null ? "" : fusionCharts.getAddNoCacheStr();

		String swfPath = fusionCharts.getSwfURL() == null ? "" : fusionCharts.getSwfURL();
		String strXML = fusionCharts.getDataXML() == null ? "" : fusionCharts.getDataXML();
		String chartId = fusionCharts.getChartId() == null ? "" : fusionCharts.getChartId();
		int chartWidth = fusionCharts.getChartWidth() <= 0 ? 600 : fusionCharts.getChartWidth();
		int chartHeight = fusionCharts.getChartHeight() <= 0 ? 300 : fusionCharts.getChartHeight();

		String encodeDataURL = encodeDataURL(strDataURL,addNoCacheStr,fusionCharts.getResponse());

		return createChart(swfPath,encodeDataURL,strXML,chartId,chartWidth,chartHeight,
				fusionCharts.isDebugMode(),fusionCharts.isRegisterWithJS());
	}


	/**
     * Encodes the dataURL before it's served to FusionCharts.
     * If you have parameters in your dataURL, you necessarily need to encode it.
     * @param strDataURL - dataURL to be fed to chart
     * @param addNoCacheStr - Whether to add aditional string to URL to disable caching of data
     * @return
     */
    public static String encodeDataURL(String strDataURL, String addNoCacheStr, HttpServletResponse response) {
		String encodedURL = strDataURL;
		//Add the no-cache string if required
		if (addNoCacheStr.equals("true")) {
		    /*We add ?FCCurrTime=xxyyzz
		    If the dataURL already contains a ?, we add &FCCurrTime=xxyyzz
		    We send the date separated with '_', instead of the usual ':' as FusionCharts cannot handle : in URLs
		    */
		    java.util.Calendar nowCal = java.util.Calendar.getInstance();
		    java.util.Date now = nowCal.getTime();
		    java.text.SimpleDateFormat sdf = new java.text.SimpleDateFormat(
			    "MM/dd/yyyy HH_mm_ss a");
		    String strNow = sdf.format(now);
		    if (strDataURL.indexOf("?") > 0) {
			encodedURL = strDataURL + "&FCCurrTime=" + strNow;
		    } else {
			strDataURL = strDataURL + "?FCCurrTime=" + strNow;
		    }
		    encodedURL = response.encodeURL(strDataURL);

		}

		return encodedURL;
    }

    /**
     * Creates the Chart HTML+Javascript to create the FusionCharts object with the given parameters.
     * This method uses JavaScript to overcome the IE browser problem with SWF wherein you have to 'Click to activate' the control
     * @param chartSWF - SWF File Name (and Path) of the chart which you intend to plot
     * @param strURL - If you intend to use dataURL method for this chart, pass the URL as this parameter. Else, set it to "" (in case of dataXML method)
     * @param strXML - If you intend to use dataXML method for this chart, pass the XML data as this parameter. Else, set it to "" (in case of dataURL

method)
     * @param chartId - Id for the chart, using which it will be recognized in the HTML page. Each chart on the page needs to have a unique Id.
     * @param chartWidth - Intended width for the chart (in pixels)
     * @param chartHeight - Intended height for the chart (in pixels)
     * @param debugMode - Whether to start the chart in debug mode
     * @param registerWithJS - Whether to ask chart to register itself with JavaScript
     */
    public static String createChart(String chartSWF, String strURL, String strXML,
	    String chartId, int chartWidth, int chartHeight, boolean debugMode,
	    boolean registerWithJS) {
		StringBuffer strBuf = new StringBuffer();
		/*
		First we create a new DIV for each chart. We specify the name of DIV as "chartId"Div.
		DIV names are case-sensitive.
		*/
		strBuf.append("<!--START Script Block for Chart -->\n");
		strBuf.append("\t\t<div id='" + chartId + "Div' align='center'>\n");
		strBuf.append("\t\t\t\tChart.\n");

		/*The above text "Chart" is shown to users before the chart has started loading
		 (if there is a lag in relaying SWF from server). This text is also shown to users
		 who do not have Flash Player installed. You can configure it as per your needs.*/

		strBuf.append("\t\t</div>\n");

		/*Now, we render the chart using FusionCharts Class. Each chart's instance (JavaScript) Id
		 is named as chart_"chartId".*/

		strBuf.append("\t\t<script type='text/javascript'>\n");
		//Instantiate the Chart
		Boolean registerWithJSBool = new Boolean(registerWithJS);
		Boolean debugModeBool = new Boolean(debugMode);
		int regWithJSInt = boolToNum(registerWithJSBool);
		int debugModeInt = boolToNum(debugModeBool);

		strBuf.append("\t\t\t\tvar chart_" + chartId + " = new FusionCharts('"
			+ chartSWF + "', '" + chartId + "', '" + chartWidth + "', '"
			+ chartHeight + "', '" + debugModeInt + "', '" + regWithJSInt
			+ "');\n");
		//Check whether we've to provide data using dataXML method or dataURL method
		if (strXML.equals("")) {
		    strBuf.append("\t\t\t\t//Set the dataURL of the chart\n");
		    strBuf.append("\t\t\t\tchart_" + chartId + ".setDataURL(\"" + strURL
			    + "\");\n");
		} else {
		    strBuf.append("\t\t\t\t//Provide entire XML data using dataXML method\n");
		    strBuf.append("\t\t\t\tchart_" + chartId + ".setDataXML(\"" + strXML
			    + "\");\n");
		}
		strBuf.append("\t\t\t\t//Finally, render the chart.\n");
		strBuf.append("\t\t\t\tchart_" + chartId + ".render(\"" + chartId + "Div\");\n");
		strBuf.append("\t\t</script>\n");
		strBuf.append("\t\t<!--END Script Block for Chart-->\n");
		return strBuf.substring(0);
    }

    /**
     * Creates the Chart HTML to embed the swf object with the given parameters
     * @param chartSWF - SWF File Name (and Path) of the chart which you intend to plot
     * @param strURL - If you intend to use dataURL method for this chart, pass the URL as this parameter. Else, set it to "" (in case of dataXML method)
     * @param strXML - If you intend to use dataXML method for this chart, pass the XML data as this parameter. Else, set it to "" (in case of dataURL

method)
     * @param chartId - Id for the chart, using which it will be recognized in the HTML page. Each chart on the page needs to have a unique Id.
     * @param chartWidth - Intended width for the chart (in pixels)
     * @param chartHeight - Intended height for the chart (in pixels)
     * @param debugMode - Whether to start the chart in debug mode
     */

    public String createChartHTML(String chartSWF, String strURL,
	    String strXML, String chartId, int chartWidth, int chartHeight,
	    boolean debugMode) {
		/*Generate the FlashVars string based on whether dataURL has been provided
	     or dataXML.*/
		String strFlashVars = "";
		Boolean debugModeBool = new Boolean(debugMode);

		if (strXML.equals("")) {
		    //DataURL Mode
		    strFlashVars = "chartWidth=" + chartWidth + "&chartHeight="
			    + chartHeight + "&debugMode=" + boolToNum(debugModeBool)
			    + "&dataURL=" + strURL + "";
		} else {
		    //DataXML Mode
		    strFlashVars = "chartWidth=" + chartWidth + "&chartHeight="
			    + chartHeight + "&debugMode=" + boolToNum(debugModeBool)
			    + "&dataXML=" + strXML + "";
		}
		StringBuffer strBuf = new StringBuffer();

		// START Code Block for Chart
		strBuf.append("\t\t<!--START Code Block for Chart-->\n");
		strBuf
			.append("\t\t\t\t<object classid='clsid:d27cdb6e-ae6d-11cf-96b8-444553540000'

codebase='http://fpdownload.macromedia.com/pub/shockwave/cabs/flash/swflash.cab#version=8,0,0,0' width='"
				+ chartWidth
				+ "' height='"
				+ chartHeight
				+ "' id='"
				+ chartId + "'>\n");
		strBuf.append("\t\t\t\t	<param name='allowScriptAccess' value='always' />\n");
		strBuf.append("\t\t\t\t	<param name='movie' value='" + chartSWF + "'/>\n");
		strBuf.append("\t\t\t\t<param name='FlashVars' value=\"" + strFlashVars
			+ "\" />\n");
		strBuf.append("\t\t\t\t	<param name='quality' value='high' />\n");
		strBuf
			.append("\t\t\t\t<embed src='"
				+ chartSWF
				+ "' FlashVars=\""
				+ strFlashVars
				+ "\" quality='high' width='"
				+ chartWidth
				+ "' height='"
				+ chartHeight
				+ "' name='"
				+ chartId
				+ "' allowScriptAccess='always' type='application/x-shockwave-flash'

pluginspage='http://www.macromedia.com/go/getflashplayer' />\n");
		strBuf.append("\t\t</object>\n");
		// END Code Block for Chart
		strBuf.append("\t\t<!--END Code Block for Chart-->\n");
		return strBuf.substring(0);
    }

    /**
     * Converts boolean to corresponding integer
     * @param bool - The boolean that is to be converted to number
     * @return int - 0 or 1 representing the given boolean value
     */
    public static int boolToNum(Boolean bool) {
		int num = 0;
		if (bool.booleanValue()) {
		    num = 1;
		}
		return num;
    }
}
FusionCharts中文处理:
jsp方式:
response.setContentType( "text/xml; charset=UTF-8" );
OutputStream outs = response.getOutputStream();

outs.write( new byte[]{(byte)0xEF, (byte)0xBB, (byte)0xBF} );//UTF-8 BOM
outs.write(strXML.getBytes("UTF-8"));//数据
outs.flush();
outs.close();
outs = null;

response.flushBuffer();
out.clear();
out = pageContext.pushBody();
java类生成xml数据文件
FileOutputStream out = new FileOutputStream(file,true);
out.write(new byte[]{(byte)0xEF, (byte)0xBB, (byte)0xBF});//UTF-8 BOM
out.write(content.getBytes(charset));//数据
out.close();