MATLAB | 绘图复刻(十四) | 右侧对齐桑基图,及工具函数SSankey更新
hey 真的好久不见了,本期既是一期绘图复刻教程,也是我写的工具函数的版本更新,本期复刻的图片来自《Nature》:
- Elmarakeby, H.A., Hwang, J., Arafeh, R. et al. Biologically informed deep neural network for prostate cancer discovery. Nature 598, 348–352 (2021). https://doi.org/10.1038/s41586-021-03922-4
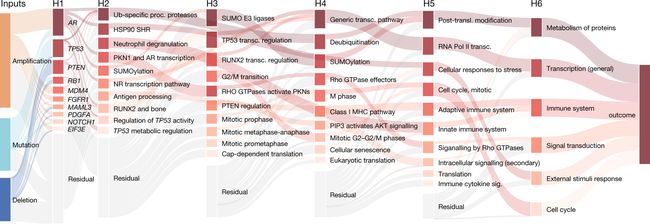
绘图复刻效果如下:

本文所用工具函数的基本使用教程可参见以下文章:
https://blog.csdn.net/slandarer/article/details/130430147
该文章仅展示工具函数基本使用方法,本文需要用到文末2.0.0版本工具函数
该文章仅展示工具函数基本使用方法,本文需要用到文末2.0.0版本工具函数


绘图复刻教程部分
0 数据
本文所使用的数据大概长这样,存储在.mat文件中:
load('natureRandData.mat')

该文件依旧可以在文末所示仓库获取,当然这组数据是通过以下方式随机生成的,直接复制以下代码也是可以的:
% rng(5)
% SourceValue=[60,40,30];
% LayerNum=[3,10,10,10,10,10,6,1];
% links{1,3}='';
% for k=1
%     TargetValue=zeros(1,LayerNum(k+1));
%     for i=1:LayerNum(k)
%         tValue=randi([1,13],[1,LayerNum(k+1)]);
%         tValue=tValue./sum(tValue).*SourceValue(i);
%         for j=1:LayerNum(k+1)
%             TargetValue(j)=TargetValue(j)+tValue(j);
%             if tValue(j)>eps
%                 tLen=size(links,1);
%                 links{tLen+1,1}=[char(64+k),num2str(i)];
%                 links{tLen+1,2}=[char(64+k+1),num2str(j)];
%                 links{tLen+1,3}=tValue(j);
%             end
%         end
%     end
%     SourceValue=TargetValue;
% end
% links(1,:)=[];
% tResidual=0;
% for k=2:5
%     [~,tindex]=sort(rand([1,10]));
%     for i=1:10
%         tLen=size(links,1);
%         TargetValue(tindex(i))=SourceValue(i);
%         links{tLen+1,1}=[char(64+k),num2str(i)];
%         links{tLen+1,2}=[char(64+k+1),num2str(tindex(i))];
%         links{tLen+1,3}=SourceValue(i);
%     end
%     for i=1:10
%         tLen=size(links,1);
%         links{tLen+1,1}=['Residual-',char(64+k)];
%         links{tLen+1,2}=[char(64+k+1),num2str(tindex(i))];
%         tValue=rand([1,1])*20./(k.^1);
%         links{tLen+1,3}=tValue;
%         if k==2,tResidual=tResidual+tValue;end
%         if k==5,TargetValue(i)=TargetValue(i)+tValue;end
%     end
%     SourceValue=TargetValue;
% end
% k=1;tValue=randi([1,13],[1,3]);
% for i=1:3
%     tLen=size(links,1);
%     links{tLen+1,1}=[char(64+k),num2str(i)];
%     links{tLen+1,2}=['Residual-',char(64+k+1)];
%     links{tLen+1,3}=tValue(i)./sum(tValue).*tResidual;
% end
% for k=6
%     TargetValue=zeros(1,LayerNum(k+1));
%     for i=1:LayerNum(k)
%         tValue=randi([1,13],[1,LayerNum(k+1)]);
%         tValue=tValue./sum(tValue).*SourceValue(i);
%         for j=1:LayerNum(k+1)
%             TargetValue(j)=TargetValue(j)+tValue(j);
%             if tValue(j)>eps
%                 tLen=size(links,1);
%                 links{tLen+1,1}=[char(64+k),num2str(i)];
%                 links{tLen+1,2}=[char(64+k+1),num2str(j)];
%                 links{tLen+1,3}=tValue(j);
%             end
%         end
%     end
%     SourceValue=TargetValue;
% end
% k=7;
% for i=1:LayerNum(end-1)
%     tLen=size(links,1);
%     links{tLen+1,1}=[char(64+k),num2str(i)];
%     links{tLen+1,2}=' ';
%     links{tLen+1,3}=SourceValue(i);
% end
% save natureRandData.mat links
1 配色
配色数据就是随便找个颜色提取器提取的论文原图:
CList1=[233,163,117; 150,209,224; 78 ,115,180]./255;
CList2=[149, 77, 85; 182, 85, 90; 208, 91, 94;
        208, 91, 94; 245,124,112; 252,150,128;
        252,173,151; 253,196,176; 253,217,203;
        254,236,228; 230,230,230]./255;
2 基础绘图
% 创建桑基图对象(Create a Sankey diagram object)
SK=SSankey(links(:,1),links(:,2),links(:,3));

% % 类似于向右侧对齐
% SK.LayerOrder='reverse';

% 修改链接颜色渲染方式(Set link color rendering method)
% 'left'/'right'/'interp'(default)/'map'/'simple'
SK.RenderingMethod='left';

% 修改对齐方式(Set alignment)
% 'up'/'down'/'center'(default)
SK.Align='center';

% 修改文本位置(Set Text Location)
% 'left'(default)/'right'/'top'/'center'/'bottom'
SK.LabelLocation='right';

% 设置缝隙占比(Separation distance proportion)
SK.Sep=0.02;
% SK.Sep=[.08,.04,.02,.05,.05,.06,.07];

% 设置方块占比(Set the scale of blocks)
% BlockScale>0 & BlockScale<1
SK.BlockScale=.16;

% 设置颜色(Set color)
SK.ColorList=[
    CList1;
    CList2(1:11,:)
    CList2(1:11,:)
    CList2(1:11,:)
    CList2(1:11,:)
    CList2(1:10,:)
    CList2(1:6,:)
    CList2(1,:)
    ];

% 开始绘图(Start drawing)
SK.draw()
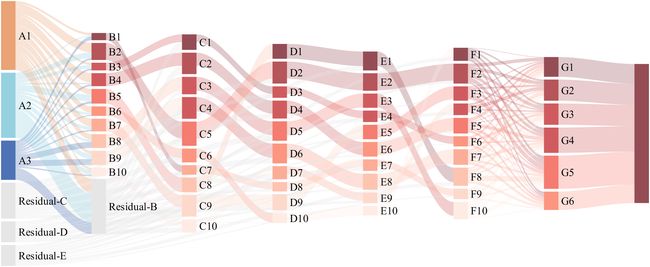
3 右侧对齐
我们发现此时有的Residual方块由于左侧没有方块会被排列在最左侧,这样会比较混乱,此时选择将LayerOrder设置为反方向(此操作要在SK.draw()之前):
% 类似于向右侧对齐
SK.LayerOrder='reverse';

4 自定义缝隙比例
我们发现由于流入流出数据不相等,越往右侧整体会越窄,而原图基本上是两端对齐的,因此我们可以调整每一层的缝隙占比,比如(此操作要在SK.draw()之前):
% 设置缝隙占比(Separation distance proportion)
% SK.Sep=0.02;
SK.Sep=[.08,.04,.02,.05,.05,.06,.07];

5 节点方块修饰
加个白框:
for i=1:SK.BN
    SK.setBlock(i,'EdgeColor',[1,1,1],'LineWidth',1)
end

6 添加标签
就直接用text硬画,第i层的横坐标就是i,而宽度是SK.BlockScale,因此比较容易找到每层的X方向中点:
FontCell={'FontSize',22,'FontName','Times New Roman','HorizontalAlignment','center','VerticalAlignment','bottom'};
for i=2:SK.LN-1
    text(i+SK.BlockScale/2,min(min(SK.LayerPos(:,3:4))),['H',num2str(i-1)],FontCell{:})
end
text(1+SK.BlockScale/2,min(min(SK.LayerPos(:,3:4))),'Input',FontCell{:})
text(8+SK.BlockScale/2,min(min(SK.LayerPos(:,3:4))),'OutCome',FontCell{:})

绘图复刻完整代码
% -----------------------------------------------------+
% @author  | slandarer                                 |
% -----------------------------------------------------+
% 复刻自   | www.nature.com/articles/s41586-021-03922-4 |
% -----------------------------------------------------+

figure('Name','nature sankey demo','Units','normalized','Position',[.05,.2,.9,.56])
clc;clear;

%% 配色 ===================================================================
CList1=[233,163,117; 150,209,224; 78 ,115,180]./255;
CList2=[149, 77, 85; 182, 85, 90; 208, 91, 94;
        208, 91, 94; 245,124,112; 252,150,128;
        252,173,151; 253,196,176; 253,217,203;
        254,236,228; 230,230,230]./255;
%% 随意构造数据 ============================================================
load('natureRandData.mat')

%% 绘图主要代码 ============================================================
% 创建桑基图对象(Create a Sankey diagram object)
SK=SSankey(links(:,1),links(:,2),links(:,3));

% 类似于向右侧对齐
SK.LayerOrder='reverse';

% 修改链接颜色渲染方式(Set link color rendering method)
% 'left'/'right'/'interp'(default)/'map'/'simple'
SK.RenderingMethod='left';

% 修改对齐方式(Set alignment)
% 'up'/'down'/'center'(default)
SK.Align='center';

% 修改文本位置(Set Text Location)
% 'left'(default)/'right'/'top'/'center'/'bottom'
SK.LabelLocation='right';

% 设置缝隙占比(Separation distance proportion)
% SK.Sep=0.02;
SK.Sep=[.08,.04,.02,.05,.05,.06,.07];

% 设置方块占比(Set the scale of blocks)
% BlockScale>0 & BlockScale<1
SK.BlockScale=.16;

% 设置颜色(Set color)
SK.ColorList=[
    CList1;
    CList2(1:11,:)
    CList2(1:11,:)
    CList2(1:11,:)
    CList2(1:11,:)
    CList2(1:10,:)
    CList2(1:6,:)
    CList2(1,:)
    ];

% 开始绘图(Start drawing)
SK.draw()
%% 修饰 ===================================================================

for i=1:SK.BN
    SK.setBlock(i,'EdgeColor',[1,1,1],'LineWidth',1)
end
FontCell={'FontSize',22,'FontName','Times New Roman','HorizontalAlignment','center','VerticalAlignment','bottom'};
for i=2:SK.LN-1
    text(i+SK.BlockScale/2,min(min(SK.LayerPos(:,3:4))),['H',num2str(i-1)],FontCell{:})
end
text(1+SK.BlockScale/2,min(min(SK.LayerPos(:,3:4))),'Input',FontCell{:})
text(8+SK.BlockScale/2,min(min(SK.LayerPos(:,3:4))),'OutCome',FontCell{:})
工具函数完整代码
classdef SSankey < handle
% Copyright (c) 2023, Zhaoxu Liu / slandarer
% =========================================================================
% @author : slandarer
% =========================================================================
% # update 2.0.0(2024-02-04)
% see natureSankeyDemo1.m
%
% + 层向右对齐(Align layers to the right)
%   try : obj.LayerOrder='reverse';
%
% + 单独调整每层间隙大小(Adjust the Sep size of each layer separately)
%   try : obj..Sep=[.2,.06,.05,.07,.07,.08,.15];
%
    properties
        Source;Target;Value;
        SourceInd;TargetInd;
        Layer;LayerPos;LayerOrder='normal';
        AdjMat;BoolMat;
        RenderingMethod='interp'  % 'left'/'right'/'interp'/'map'/'simple'
        LabelLocation='left'      % 'left'/'right'/'top'/'center'/'bottom'
        Align='center'            % 'up'/'down'/'center'
        BlockScale=0.05;          %  BlockScale>0 ! !
        Sep=0.05;                 %  Sep>=0 ! !
        NodeList={};
        ColorList=[[65,140,240;252,180,65;224,64,10;5,100,146;191,191,191;26,59,105;255,227,130;18,156,221;
                    202,107,75;0,92,219;243,210,136;80,99,129;241,185,168;224,131,10;120,147,190]./255;
                   [127,91,93;187,128,110;197,173,143;59,71,111;104,95,126;76,103,86;112,112,124;
                    72,39,24;197,119,106;160,126,88;238,208,146]./255];
        BlockHdl;LinkHdl;LabelHdl;ax;Parent;
        BN;LN;VN;TotalLen;SepLen;
        arginList={'RenderingMethod','LabelLocation','BlockScale',...
                   'Sep','Align','ColorList','Parent','NameList'}
    end
% 构造函数 =================================================================
    methods
        function obj=SSankey(varargin)
            % 获取基本数据 -------------------------------------------------
            if isa(varargin{1},'matlab.graphics.axis.Axes')
                obj.ax=varargin{1};varargin(1)=[];
            else
            end
            obj.Source=varargin{1};
            obj.Target=varargin{2};
            obj.Value=varargin{3};
            varargin(1:3)=[];
            % 获取其他信息 -------------------------------------------------
            for i=1:2:(length(varargin)-1)
                tid=ismember(obj.arginList,varargin{i});
                if any(tid)
                obj.(obj.arginList{tid})=varargin{i+1};
                end
            end
            if isempty(obj.ax)&&(~isempty(obj.Parent)),obj.ax=obj.Parent;end
            if isempty(obj.ax),obj.ax=gca;end
            obj.ax.NextPlot='add';
            % 基本数据预处理 -----------------------------------------------
            if isempty(obj.NodeList)
                obj.NodeList=[obj.Source;obj.Target];
                obj.NodeList=unique(obj.NodeList,'stable');
            end
            obj.BN=length(obj.NodeList);
            if length(obj.NodeList)>size(obj.ColorList,1)
                obj.ColorList=[obj.ColorList;rand(length(obj.NodeList),3).*.7];
            end
            obj.VN=length(obj.Value);
            % 坐标区域基础设置 ---------------------------------------------
            obj.ax.YDir='reverse';
            obj.ax.XColor='none';
            obj.ax.YColor='none';
        end
% 绘图函数 =================================================================
        function draw(obj)
            % 生成整体邻接矩阵 ---------------------------------------------
            obj.AdjMat=zeros(obj.BN,obj.BN);
            for i=1:length(obj.Source)
                obj.SourceInd(i)=find(strcmp(obj.Source{i},obj.NodeList));
                obj.TargetInd(i)=find(strcmp(obj.Target{i},obj.NodeList));
                obj.AdjMat(obj.SourceInd(i),obj.TargetInd(i))=obj.Value{i};
            end
            obj.BoolMat=abs(obj.AdjMat)>0;
            % 计算每个对象位于的层、每层方块长度、每个方块位置 ----------------
            if strcmp(obj.LayerOrder,'normal')
                obj.Layer=zeros(obj.BN,1);
                obj.Layer(sum(obj.BoolMat,1)==0)=1;
                startMat=diag(obj.Layer);
                for i=1:(obj.BN-1)
                    tLayer=(sum(startMat*obj.BoolMat^i,1)>0).*(i+1);
                    obj.Layer=max([obj.Layer,tLayer'],[],2);
                end
            else
                obj.Layer=zeros(obj.BN,1);
                obj.Layer(sum(obj.BoolMat,2)==0)=-1;
                startMat=diag(obj.Layer);
                for i=1:(obj.BN-1)
                    tLayer=(sum(startMat*(obj.BoolMat.')^i,1)<0).*(-i-1);
                    obj.Layer=min([obj.Layer,tLayer'],[],2);
                end
                obj.Layer=obj.Layer-min(obj.Layer)+1;
            end
            obj.LN=max(obj.Layer);
            obj.TotalLen=max([sum(obj.AdjMat,1).',sum(obj.AdjMat,2)],[],2);
            obj.SepLen=max(obj.TotalLen).*obj.Sep;
            obj.LayerPos=zeros(obj.BN,4);
            for i=1:obj.LN
                tBlockInd=find(obj.Layer==i);
                tBlockLen=[0;cumsum(obj.TotalLen(tBlockInd))];
                tY1=tBlockLen(1:end-1)+(0:length(tBlockInd)-1).'.*obj.SepLen(min(i,length(obj.Sep)));
                tY2=tBlockLen(2:end)+(0:length(tBlockInd)-1).'.*obj.SepLen(min(i,length(obj.Sep)));
                obj.LayerPos(tBlockInd,3)=tY1;
                obj.LayerPos(tBlockInd,4)=tY2;
                % for j=1:length(tY2)
                %     plot([i,i],[tY1(j),tY2(j)],'LineWidth',2)
                % end
            end
            obj.LayerPos(:,1)=obj.Layer;
            obj.LayerPos(:,2)=obj.Layer+obj.BlockScale;
            % 根据对齐方式调整Y坐标 -----------------------------------------
            tMinY=min(obj.LayerPos(:,3));
            tMaxY=max(obj.LayerPos(:,4));
            for i=1:obj.LN
                tBlockInd=find(obj.Layer==i);
                tBlockPos3=obj.LayerPos(tBlockInd,3);
                tBlockPos4=obj.LayerPos(tBlockInd,4);
                switch obj.Align
                    case 'up'
                    case 'down'
                        obj.LayerPos(tBlockInd,3)=obj.LayerPos(tBlockInd,3)+tMaxY-max(tBlockPos4);
                        obj.LayerPos(tBlockInd,4)=obj.LayerPos(tBlockInd,4)+tMaxY-max(tBlockPos4);
                    case 'center'
                        obj.LayerPos(tBlockInd,3)=obj.LayerPos(tBlockInd,3)+...
                            min(tBlockPos3)/2-max(tBlockPos4)/2+tMinY/2-tMaxY/2;
                        obj.LayerPos(tBlockInd,4)=obj.LayerPos(tBlockInd,4)+...
                            min(tBlockPos3)/2-max(tBlockPos4)/2+tMinY/2-tMaxY/2;
                end
            end
            % 绘制连接 -----------------------------------------------------
            for i=1:obj.VN
                tSource=obj.SourceInd(i);
                tTarget=obj.TargetInd(i);
                tS1=sum(obj.AdjMat(tSource,1:(tTarget-1)))+obj.LayerPos(tSource,3);
                tS2=sum(obj.AdjMat(tSource,1:tTarget))+obj.LayerPos(tSource,3);
                tT1=sum(obj.AdjMat(1:(tSource-1),tTarget))+obj.LayerPos(tTarget,3);
                tT2=sum(obj.AdjMat(1:tSource,tTarget))+obj.LayerPos(tTarget,3);
                if isempty(tS1),tS1=0;end
                if isempty(tT1),tT1=0;end
                tX=[obj.LayerPos(tSource,1),obj.LayerPos(tSource,2),obj.LayerPos(tTarget,1),obj.LayerPos(tTarget,2)];
                qX=linspace(obj.LayerPos(tSource,1),obj.LayerPos(tTarget,2),200);qT=linspace(0,1,50);
                qY1=interp1(tX,[tS1,tS1,tT1,tT1],qX,'pchip');
                qY2=interp1(tX,[tS2,tS2,tT2,tT2],qX,'pchip');
                XX=repmat(qX,[50,1]);YY=qY1.*(qT'.*0+1)+(qY2-qY1).*(qT');
                MeshC=ones(50,200,3);
                switch obj.RenderingMethod
                    case 'left'
                        MeshC(:,:,1)=MeshC(:,:,1).*obj.ColorList(tSource,1);
                        MeshC(:,:,2)=MeshC(:,:,2).*obj.ColorList(tSource,2);
                        MeshC(:,:,3)=MeshC(:,:,3).*obj.ColorList(tSource,3);
                    case 'right'
                        MeshC(:,:,1)=MeshC(:,:,1).*obj.ColorList(tTarget,1);
                        MeshC(:,:,2)=MeshC(:,:,2).*obj.ColorList(tTarget,2);
                        MeshC(:,:,3)=MeshC(:,:,3).*obj.ColorList(tTarget,3);
                    case 'interp'
                        MeshC(:,:,1)=repmat(linspace(obj.ColorList(tSource,1),obj.ColorList(tTarget,1),200),[50,1]);
                        MeshC(:,:,2)=repmat(linspace(obj.ColorList(tSource,2),obj.ColorList(tTarget,2),200),[50,1]);
                        MeshC(:,:,3)=repmat(linspace(obj.ColorList(tSource,3),obj.ColorList(tTarget,3),200),[50,1]);
                    case 'map'
                        MeshC=MeshC(:,:,1).*obj.Value{i};
                    case 'simple'
                        MeshC(:,:,1)=MeshC(:,:,1).*.6;
                        MeshC(:,:,2)=MeshC(:,:,2).*.6;
                        MeshC(:,:,3)=MeshC(:,:,3).*.6;
                end
                obj.LinkHdl(i)=surf(obj.ax,XX,YY,XX.*0,'EdgeColor','none','FaceAlpha',.3,'CData',MeshC);
            end
            % 绘制方块 -----------------------------------------------------
            for i=1:obj.BN
                obj.BlockHdl(i)=fill(obj.ax,obj.LayerPos(i,[1,2,2,1]),...
                    obj.LayerPos(i,[3,3,4,4]),obj.ColorList(i,:),'EdgeColor','none');
            end
            % 绘制文本 -----------------------------------------------------
            for i=1:obj.BN
                switch obj.LabelLocation
                    case 'right'
                        obj.LabelHdl(i)=text(obj.ax,obj.LayerPos(i,2),mean(obj.LayerPos(i,[3,4])),...
                            [' ',obj.NodeList{i}],'FontSize',15,'FontName','Times New Roman','HorizontalAlignment','left');
                    case 'left'
                        obj.LabelHdl(i)=text(obj.ax,obj.LayerPos(i,1),mean(obj.LayerPos(i,[3,4])),...
                            [obj.NodeList{i},' '],'FontSize',15,'FontName','Times New Roman','HorizontalAlignment','right');
                    case 'top'
                        obj.LabelHdl(i)=text(obj.ax,mean(obj.LayerPos(i,[1,2])),obj.LayerPos(i,3),...
                            obj.NodeList{i},'FontSize',15,'FontName','Times New Roman','HorizontalAlignment','center','VerticalAlignment','bottom');
                    case 'center'
                        obj.LabelHdl(i)=text(obj.ax,mean(obj.LayerPos(i,[1,2])),mean(obj.LayerPos(i,[3,4])),...
                            obj.NodeList{i},'FontSize',15,'FontName','Times New Roman','HorizontalAlignment','center');
                    case 'bottom'
                        obj.LabelHdl(i)=text(obj.ax,mean(obj.LayerPos(i,[1,2])),obj.LayerPos(i,4),...
                            obj.NodeList{i},'FontSize',15,'FontName','Times New Roman','HorizontalAlignment','center','VerticalAlignment','top');
                end
            end
            % -------------------------------------------------------------
            axis tight;help SSankey
        end
% =========================================================================
        function setBlock(obj,n,varargin)
            set(obj.BlockHdl(n),varargin{:})
        end
        function setLink(obj,n,varargin)
            set(obj.LinkHdl(n),varargin{:})
        end
        function setLabel(obj,n,varargin)
            set(obj.LabelHdl(n),varargin{:})
        end
        function moveBlockY(obj,n,dy)
            obj.LayerPos(n,[3,4])=obj.LayerPos(n,[3,4])-dy;
            set(obj.BlockHdl(n),'YData',obj.LayerPos(n,[3,3,4,4]));
            switch obj.LabelLocation
                case 'right',set(obj.LabelHdl(n),'Position',[obj.LayerPos(n,2),mean(obj.LayerPos(n,[3,4]))]);
                case 'left',set(obj.LabelHdl(n),'Position',[obj.LayerPos(n,1),mean(obj.LayerPos(n,[3,4]))]);
                case 'top',set(obj.LabelHdl(n),'Position',[mean(obj.LayerPos(n,[1,2])),obj.LayerPos(n,3)]);
                case 'center',set(obj.LabelHdl(n),'Position',[mean(obj.LayerPos(n,[1,2])),mean(obj.LayerPos(n,[3,4]))]);
                case 'bottom',set(obj.LabelHdl(n),'Position',[mean(obj.LayerPos(n,[1,2])),obj.LayerPos(n,4)]);
            end
            for i=1:obj.VN
                tSource=obj.SourceInd(i);
                tTarget=obj.TargetInd(i);
                if tSource==n||tTarget==n
                    tS1=sum(obj.AdjMat(tSource,1:(tTarget-1)))+obj.LayerPos(tSource,3);
                    tS2=sum(obj.AdjMat(tSource,1:tTarget))+obj.LayerPos(tSource,3);
                    tT1=sum(obj.AdjMat(1:(tSource-1),tTarget))+obj.LayerPos(tTarget,3);
                    tT2=sum(obj.AdjMat(1:tSource,tTarget))+obj.LayerPos(tTarget,3);
                    if isempty(tS1),tS1=0;end
                    if isempty(tT1),tT1=0;end
                    tX=[obj.LayerPos(tSource,1),obj.LayerPos(tSource,2),obj.LayerPos(tTarget,1),obj.LayerPos(tTarget,2)];
                    qX=linspace(obj.LayerPos(tSource,1),obj.LayerPos(tTarget,2),200);qT=linspace(0,1,50);
                    qY1=interp1(tX,[tS1,tS1,tT1,tT1],qX,'pchip');
                    qY2=interp1(tX,[tS2,tS2,tT2,tT2],qX,'pchip');
                    YY=qY1.*(qT'.*0+1)+(qY2-qY1).*(qT');
                    set(obj.LinkHdl(i),'YData',YY);
                end
            end
        end
    end
% Copyright (c) 2023, Zhaoxu Liu / slandarer
% =========================================================================
% @author : slandarer
% -------------------------------------------------------------------------
end
完
以上已经是完整代码,对于工具函数2.0.0更新版,未经允许本代码请勿作商业用途,引用的话可以引用我file exchange上的链接,可使用如下格式:
Zhaoxu Liu / slandarer (2023). sankey plot (https://www.mathworks.com/matlabcentral/fileexchange/128679-sankey-plot), MATLAB Central File Exchange. 检索来源 2023/4/28.
若转载请保留以上file exchange链接及本文链接!!!!!
该工具可通过上述fileexchange链接获取,或者通过以下gitee仓库下载:
https://gitee.com/slandarer/matlab-sankey-diagram
对于绘图复刻以及.mat文件,可以去以下gitee仓库获取全部代码:
https://gitee.com/slandarer/PLTreprint/