MATLAB Fundamentals>>>(2/2) Project - Analyze Vehicle Data
#创作灵感#
MATLAB基础知识官方课程学习笔记
MATLAB Fundamentals>Common Data Analysis Techniques>Summary of Common Data Analysis Techniques>(2/2) Project - Analyze Vehicle Data
任务名称:Fuel Economy Analysis
任务1:
The variable mpg contains NaN values. Find the rows in mpg with NaN values, and remove those rows from all three data vectors: mpg, hp, and wt.
解答1:
nanIdx = ismissing(mpg)
mpg = mpg(~nanIdx);
hp = hp(~nanIdx);
wt = wt(~nanIdx);
结果1:

背景:
Fuel economy in the U.S. is typically given in miles/gallon. In many countries, however, the standard units are liters/100km.
Given mpg, you can calculate economy in L/100km by dividing 235.214583 by mpg.
任务2:
Create a variable econ that contains the fuel economy in L/100km rather than miles/gallon.
Combine the data for weight, horsepower, and fuel economy in L/100km (in that order) into a 48-by-3 matrix called numdata.
解答2:
econ = 235.214583./mpg
numdata = [wt hp econ]
笔记:注意mpg是个向量,需要使用”./“。
结果2:

任务3:
Create a matrix of the scatter plots of the variables in numdata (weight, horsepower, and fuel economy) in a single figure.
Calculate the corresponding correlation coefficients and store them as a matrix called cc.
解答3:
plotmatrix(numdata)
cc = corrcoef(numdata)
结果3:

任务4:
Determine the best-fit line (i.e., a first degree polynomial fit) for fuel economy (in L/100km) as a function of vehicle weight.
Evaluate the fitted model at the weights in the data. Store the fitted values in a vector called econFit.
Note that you do not need to use centering and scaling for the fit.
解答4:
c = polyfit(wt,econ,1)
econFit = polyval(c,wt)
结果4:

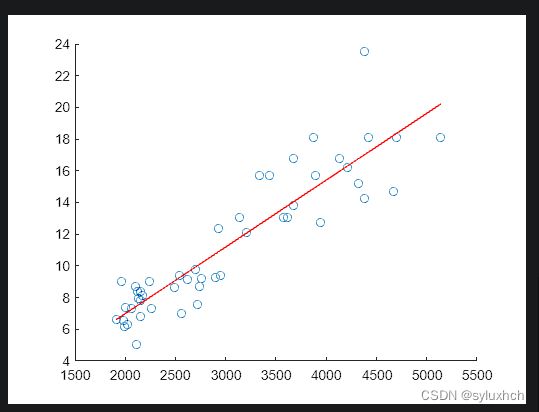
任务5:
Create a scatter plot of fuel economy against weight, and add the best-fit line as a red line.
解答5:
scatter(wt,econ)
hold on
plot(wt,econFit,"r")
hold off
结果5:
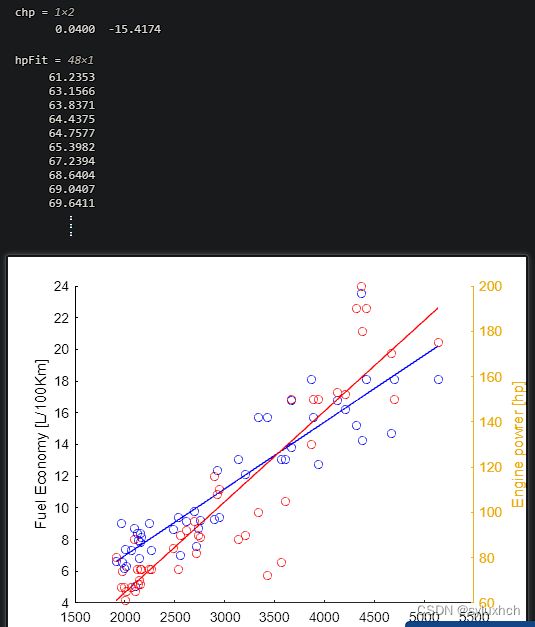
附加练习:
Try fitting a line to horsepower as a function of weight. Try plotting both scatter plots and fits together, using yyaxis to accommodate the different scales:

附加练习解答:
chp = polyfit(wt,hp,1)
hpFit = polyval(chp,wt)
yyaxis right
hold on
scatter(wt,hp)
plot(wt,hpFit)
hold off
附加练习结果: