自定义Echarts中legend、tooltip等样式
文章目录
-
- 自定义Echarts中legend、tooltip等样式
-
-
-
- legend.formatter
- legend. textStyle
- legend.textStyle. rich
- 实例
- 效果图
- 参考文档
-
-
自定义Echarts中legend、tooltip等样式
在使用Echarts图表中不可避免的要定义legend、tooltip中的样式,这里以legend为例介绍一下通用的方法
先介绍一下用到的属性
legend.formatter
用来格式化图例文本,支持字符串模板和回调函数两种形式。
示例:
// 使用字符串模板,模板变量为图例名称 {name}
formatter: 'Legend {name}'
// 使用回调函数
formatter: function (name) {
    return 'Legend ' + name;
}
legend. textStyle
图例的公用文本样式,在这可以设置legend的整体样式,有多种属性进行选择,可以在官方文档进行查看,这里不一一介绍了
重要介绍的是其子属性rich
legend.textStyle. rich
官方解释如下
在 rich 里面,可以自定义富文本样式。利用富文本样式,可以在标签中做出非常丰富的效果。
例如:
label: {
    // 在文本中,可以对部分文本采用 rich 中定义样式。
    // 这里需要在文本中使用标记符号:
    // `{styleName|text content text content}` 标记样式名。
    // 注意,换行仍是使用 '\n'。
    formatter: [
        '{a|这段文本采用样式a}',
        '{b|这段文本采用样式b}这段用默认样式{x|这段用样式x}'
    ].join('\n'),

    rich: {
        a: {
            color: 'red',
            lineHeight: 10
        },
        b: {
            backgroundColor: {
                image: 'xxx/xxx.jpg'
            },
            height: 40
        },
        x: {
            fontSize: 18,
            fontFamily: 'Microsoft YaHei',
            borderColor: '#449933',
            borderRadius: 4
        },
        ...
    }
}
官方解释已经很明了,接下来直接看实例
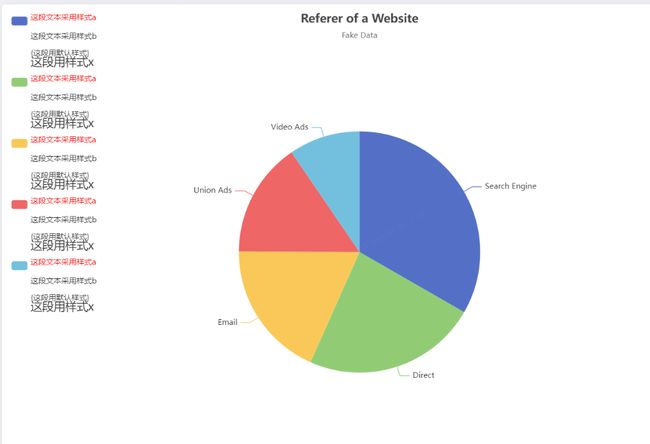
实例
这里是一个扇形图
直接上代码
option = {
  title: {
    text: 'Referer of a Website',
    subtext: 'Fake Data',
    left: 'center'
  },
  tooltip: {
    trigger: 'item'
  },
  legend: {
    orient: 'vertical',
    left: 'left',
    formatter: ['{ttt|这段文本采用样式a}',
              '{b|这段文本采用样式b}',
              '{这段用默认样式}',
              '{x|这段用样式x}'].join('\n'),
    textStyle:{
      padding: [60, 0, 0, 0],
       rich: {
        ttt: {
            color: 'red',
            lineHeight: 20,

        },
        b: {
            backgroundColor: {
                image: 'xxx/xxx.jpg'
            },
            height: 40
        },
        x: {
            fontSize: 18,
            fontFamily: 'Microsoft YaHei',
            borderColor: '#449933',
            borderRadius: 4
        },
      }
    },
  },
  series: [
    {
      name: 'Access From',
      type: 'pie',
      radius: '50%',
      data: [
        { value: 1048, name: 'Search Engine' },
        { value: 735, name: 'Direct' },
        { value: 580, name: 'Email' },
        { value: 484, name: 'Union Ads' },
        { value: 300, name: 'Video Ads' }
      ],
      emphasis: {
        itemStyle: {
          shadowBlur: 10,
          shadowOffsetX: 0,
          shadowColor: 'rgba(0, 0, 0, 0.5)'
        }
      }
    }
  ]
};
效果图
参考文档
echarts官网