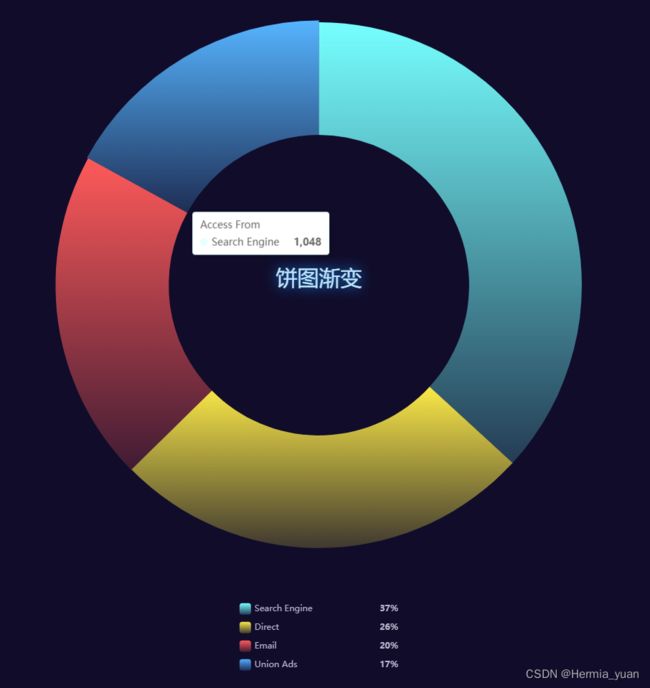
option = {
  title:{
    text: "{name|饼图渐变}",
    top: 580,
    left: "center",
    textStyle: {
      rich: {
        name: {
          fontSize: 30,
          lineHeight: 20,
          fontWeight: 400,
          color: "rgba(190, 229, 251, 1)",
          textShadowColor:"#158EFF",
          textShadowBlur: 18,

        },
      },
    },
  },
  tooltip: {
    trigger: 'item'
  },
  legend: {
    bottom:'5%',
    left: 'center',
    selectedMode: false,
    itemHeight: 16,  // 图例图形的高
    itemWidth: 16,   // 图例图形的宽
    orient: "vertical",  // 竖排
    textStyle: {
			rich: {
				a: {
					align: "left",  // 图例文字的对齐方式
					width: 120      // w文字宽度
				},
				b: {
					align: "left",
					fontWeight: "bold",
					width: 40
				}
			}
		},
    formatter: (name) => {  // 图例后面加数据
        var data = option.series[0].data;//获取series中的data
        var total = 0;
        var tarValue;
        for (var i = 0, l = data.length; i < l; i++) {
            total += data[i].value;
            if (data[i].name == name) {
                tarValue = data[i].value;
            }
        }
        var p = ((tarValue / total) * 100).toFixed(0); // 不保留小数
        return `{a|${name}}{b|${p}%}`;
    },
  },
  series: [
    {
      name: 'Access From',
      type: 'pie',
      radius: ['40%', '70%'], // 饼图的大小
      center: ["50%", "34%"], // 饼图上下左右位置
      avoidLabelOverlap: false,
      label: {
        show: false,
      },
      emphasis: {
        label: {
          show: false,
        }
      },
      labelLine: {
        show: false
      },
      data: [
        { value: 1048, name: 'Search Engine' ,itemStyle: {
        normal: {//颜色渐变 如果echarts 报错未定义 就将echarts改为this.$echarts
            color: new echarts.graphic.LinearGradient(
                1, 1, 1, 0,  //(上-下 渐变)
                // 1, 1, 0, 0,  //(左上-右下 渐变)
                // 1, 0, 0, 0,  //(左-右 渐变)
                // 0, 1, 1, 0,  //(右上-左下 渐变)
                // 0, 1, 1, 1,  //(左-右 渐变)
                // 1, 0, 1, 1,  //(上-下 渐变)
                // 0, 0, 1, 0,  //(左-右 渐变)
                // 0, 0, 0, 1,  //(上-下 渐变)
                [
                    {offset: 0, color: 'rgba(118, 255, 255, 0.2)'},
                    {offset: 1, color: 'rgba(118, 255, 255, 1)'},
                ]
            )
        }
      },},
        { value: 735,
          name: 'Direct' ,
          itemStyle: {
            color: new echarts.graphic.LinearGradient( 1, 1, 1, 0,
                [
                    {offset: 0, color: 'rgba(251, 233, 71, 0.2)'},
                    {offset: 1, color: 'rgba(251, 233, 71, 1)'},
                ]
            )
          },
        },
        { value: 580, name: 'Email',
          itemStyle: {
            color: new echarts.graphic.LinearGradient( 1, 1, 1, 0,
                [
                    {offset: 0, color: 'rgba(255, 90, 90, 0.2)'},
                    {offset: 1, color: 'rgba(255, 90, 90, 1)'},
                ]
            )
          },
        },
        { value: 484, name: 'Union Ads',
          itemStyle: {
            color: new echarts.graphic.LinearGradient( 1, 1, 1, 0,
                [
                    {offset: 0, color: 'rgba(82, 172, 255, 0.2)'},
                    {offset: 1, color: 'rgba(82, 172, 255, 1)'},
                ]
            )
          },
        },
      ]
    }
  ]
};

