Kube-Prometheus 监控Ingress实战
Kube-Prometheus 监控Ingress
Kube-Prometheus 是一个在 Kubernetes 上运行的 Prometheus 堆栈,它提供了一种方便的方式来监控你的 Kubernetes 集群。在本文中,我们将介绍如何使用 Kube-Prometheus 来监控 Kubernetes Ingress。
1、前提条件
在开始之前,你需要确保你已经在你的 Kubernetes 集群上安装了以下组件:
- Kube-Prometheus
- Ingress Controller(例如 NGINX Ingress Controller)
- Kubernetes v1.23.0集群
如果没有,这可以参考下方博客进行部署构建
Kube-Prometheus 手动部署
Kubernetes安装ingress-nginx
使用kubeadm部署一套Kubernetes v1.23.0集群
2、Ingress介绍
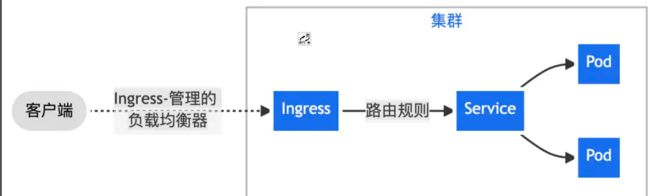
在 Kubernetes 集群中,我们通常使用 “Nginx Ingress” 实现集群南北向流量的代理转发,Nginx Ingress 基于集群内 Ingress 资源配置生成具体的路由规则。Ingress 资源负责对外公开服务的管理,一般这类服务通过 HTTP 协议进行访问。通过 Nginx Ingress + Ingress 资源可以实现以下场景:
一、通过 Nginx Ingress 将来自客户端的全部流量转发给单一 Service。
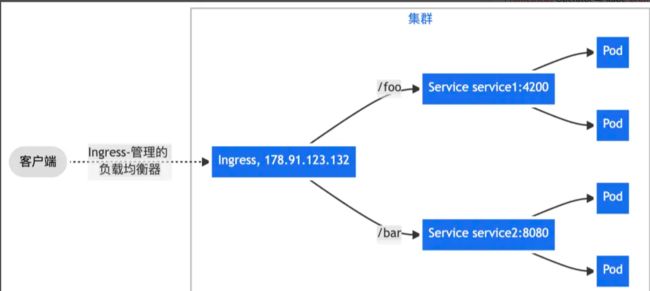
二、通过 Nginx Ingress 实现更复杂的路由转发规则,将来自单一绑定 IP 地址的所有流量根据 URL 请求路径前缀转发给不同的 Service。
三、根据 HTTP 请求头部携带的 Host 字段——通常由访问的域名决定,将来自单一绑定 IP 地址的流量分发给不同后端 Service,实现基于名称的虚拟主机(Name-based Virtual Hosting)能力。

通常,围绕 Nginx Ingress 网关监控场景,我们通常会关注两类核心指标数据:
- 工作负载资源
即 Nginx Ingress Controller Pod 的负载情况,当 CPU 、内存等资源水位处于饱和或过载,会导致集群对外服务不稳定。针对“工作负载监控”,一般建议关注 “USE” 指标,即:使用率(Utilization)、饱和度(Saturation)、错误率(Errors)。对此,阿里云 Prometheus 监控提供了预置性能监控大盘,可参考 《工作负载性能监控组件接入》 [1] 完成数据采集与大盘创建。
- 入口请求流量
包括集群范围全局的流量、某个 Ingress 规则转发的流量、某个 Service 的流量,以及对应的成功率/错误率、延迟,乃至请求来源的地址、设备等信息的分析与统计。针对“入口请求流量监控”,一般建议关注 “RED” 指标,即:请求速率(Rate)、请求失败数(Errors)、请求延迟(Duration)。可通过本文最佳实践实现接入。
3、Ingress配置
Ingress的监控端口:10254
查看SVC,POD

1、修改Ingress deployment内容
apiVersion: v1
kind: Deployment
metadata:
  annotations:
    prometheus.io/scrape: "true"
    prometheus.io/port: "10254"
..
spec:
  ports:
    - name: prometheus
      containerPort: 10254
      ..

重新apply一下yaml文件让修改的配置生效
kubectl apply -f ingress-deploy.yml
或者
因为已经部署可以直接编辑
kubectl edit deployments.apps -n ingress-nginx ingress-nginx-controller


        ports:
        - containerPort: 10254
          hostPort: 10254
          name: prometheus
          protocol: TCP

之后保存退出
注意:这边有个坑,因为我的Ingress是使用的hostnetwork 固定node01 上,
所以保存重启 会失败,因为80 和 443 端口已经被占用。
解决问题:备份原本Ingress的yaml文件,删除Ingress的deployment,在使用yaml文件重建 即可
hostNetwork: true
nodeName: node01
nodeSelector:
kubernetes.io/os: linux
2、修改Ingress Service内容
apiVersion: v1
kind: Service
metadata:
 annotations:
   prometheus.io/scrape: "true"
   prometheus.io/port: "10254"
..
spec:
  ports:
  - name: prometheus
    port: 10254
    targetPort: 10254
..
---
apiVersion: v1
kind: Service
metadata:
  annotations: #svc 这一块必须要加,不然不会监控到
    prometheus.io/port: '10254'
    prometheus.io/scrape: 'true'
  labels:
    app.kubernetes.io/component: controller
    app.kubernetes.io/instance: ingress-nginx
    app.kubernetes.io/managed-by: Helm
    app.kubernetes.io/name: ingress-nginx
    app.kubernetes.io/version: 1.0.0
    helm.sh/chart: ingress-nginx-4.0.1
  name: ingress-nginx-controller
  namespace: ingress-nginx
spec:
  ports:
    - appProtocol: http
      name: http
      port: 80
      protocol: TCP
      targetPort: http
    - appProtocol: https
      name: https
      port: 443
      protocol: TCP
      targetPort: https
    - name: prometheus
      port: 10254
      protocol: TCP
      targetPort: prometheus
  selector:
    app.kubernetes.io/component: controller
    app.kubernetes.io/instance: ingress-nginx
    app.kubernetes.io/name: ingress-nginx
  sessionAffinity: None
  type: ClusterIP
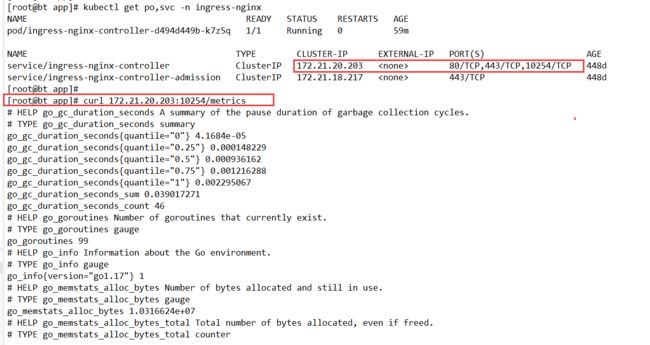
3、测试一下修改是否正常
[root@bt app]# kubectl get po,svc -n ingress-nginx
NAME                                           READY   STATUS    RESTARTS   AGE
pod/ingress-nginx-controller-d494d449b-k7z5q   1/1     Running   0          59m

NAME                                         TYPE        CLUSTER-IP      EXTERNAL-IP   PORT(S)                    AGE
service/ingress-nginx-controller             ClusterIP   172.21.20.203   <none>        80/TCP,443/TCP,10254/TCP   448d
service/ingress-nginx-controller-admission   ClusterIP   172.21.18.217   <none>        443/TCP                    448d
[root@bt app]#
[root@bt app]# curl 172.21.20.203:10254/metrics
# HELP go_gc_duration_seconds A summary of the pause duration of garbage collection cycles.
# TYPE go_gc_duration_seconds summary
go_gc_duration_seconds{quantile="0"} 4.1684e-05
go_gc_duration_seconds{quantile="0.25"} 0.000148229
go_gc_duration_seconds{quantile="0.5"} 0.000936162
go_gc_duration_seconds{quantile="0.75"} 0.001216288
go_gc_duration_seconds{quantile="1"} 0.002295067
go_gc_duration_seconds_sum 0.039017271
go_gc_duration_seconds_count 46
# HELP go_goroutines Number of goroutines that currently exist.
4、ServiceMonitor
新增Ingress ServiceMonitor
查询标签
[root@bt app]# kubectl get svc -n ingress-nginx  --show-labels
NAME                                 TYPE        CLUSTER-IP      EXTERNAL-IP   PORT(S)                    AGE    LABELS
ingress-nginx-controller             ClusterIP   172.21.20.203   <none>        80/TCP,443/TCP,10254/TCP   448d   app.kubernetes.io/component=controller,app.kubernetes.io/instance=ingress-nginx,app.kubernetes.io/managed-by=Helm,app.kubernetes.io/name=ingress-nginx,app.kubernetes.io/version=1.0.0,helm.sh/chart=ingress-nginx-4.0.1
ingress-nginx-controller-admission   ClusterIP   172.21.18.217   <none>        443/TCP                    448d   app.kubernetes.io/component=controller,app.kubernetes.io/instance=ingress-nginx,app.kubernetes.io/managed-by=Helm,app.kubernetes.io/name=ingress-nginx,app.kubernetes.io/version=1.0.0,helm.sh/chart=ingress-nginx-4.0.1
根据此处的标签来填写下面的selector 匹配标签
apiVersion: monitoring.coreos.com/v1
kind: ServiceMonitor
metadata:
    name: ingress-nginx
    namespace: monitoring
spec:
  endpoints:
  - interval: 15s
    port: prometheus
  namespaceSelector:
    matchNames:
    - ingress-nginx
  selector:
    matchLabels: #此处不是乱写的,要根据自己实际情况,查标签
      app.kubernetes.io/component: controller
      app.kubernetes.io/instance: ingress-nginx
      app.kubernetes.io/name: ingress-nginx
      app.kubernetes.io/version: 1.0.0

---
# 在对应的ns中创建角色
apiVersion: rbac.authorization.k8s.io/v1
kind: Role
metadata:
  name: prometheus-k8s
  namespace: ingress-nginx
rules:
- apiGroups:
  - ""
  resources:
  - services
  - endpoints
  - pods
  verbs:
  - get
  - list
  - watch
---
# 绑定角色 prometheus-k8s 角色到 Role
apiVersion: rbac.authorization.k8s.io/v1
kind: RoleBinding
metadata:
  name: prometheus-k8s
  namespace: ingress-nginx
roleRef:
  apiGroup: rbac.authorization.k8s.io
  kind: Role
  name: prometheus-k8s
subjects:
- kind: ServiceAccount
  name: prometheus-k8s # Prometheus 容器使用的 serviceAccount,kube-prometheus默认使用prometheus-k8s这个用户
  namespace: monitoring
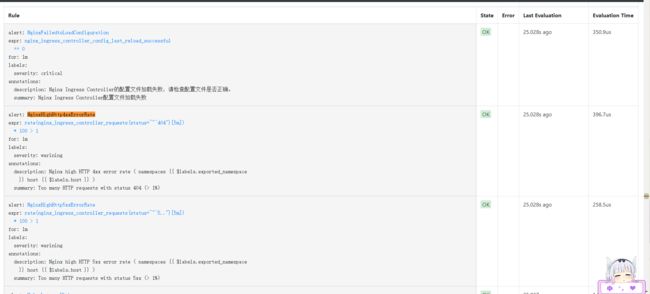
5、添加报警规则
apiVersion: monitoring.coreos.com/v1
kind: PrometheusRule
metadata:
  labels:
    prometheus: k8s
    role: alert-rules
  name: nginx-ingress-rules
  namespace: monitoring
spec:
  groups:
  - name: nginx-ingress-rules
    rules:
    - alert: NginxFailedtoLoadConfiguration
      expr: nginx_ingress_controller_config_last_reload_successful == 0
      for: 1m
      labels:
        severity: critical
      annotations:
        summary: "Nginx Ingress Controller配置文件加载失败"
        description: "Nginx Ingress Controller的配置文件加载失败,请检查配置文件是否正确。"
    - alert: NginxHighHttp4xxErrorRate
      expr: rate(nginx_ingress_controller_requests{status=~"^404"}[5m]) * 100 > 1
      for: 1m
      labels:
        severity: warining
      annotations:
        description: Nginx high HTTP 4xx error rate ( namespaces {{ $labels.exported_namespace }} host {{ $labels.host }} )
        summary: "Too many HTTP requests with status 404 (> 1%)"
    - alert: NginxHighHttp5xxErrorRate
      expr: rate(nginx_ingress_controller_requests{status=~"^5.."}[5m]) * 100 > 1
      for: 1m
      labels:
        severity: warining
      annotations:
        description: Nginx high HTTP 5xx error rate ( namespaces {{ $labels.exported_namespace }} host {{ $labels.host }} )
        summary: "Too many HTTP requests with status 5xx (> 1%)"
    - alert: NginxLatencyHigh
      expr: histogram_quantile(0.99, sum(rate(nginx_ingress_controller_request_duration_seconds_bucket[2m])) by (host, node)) > 3
      for: 2m
      labels:
        severity: warining
      annotations:
       description: Nginx latency high ( namespaces {{ $labels.exported_namespace }} host {{ $labels.host }} )
       summary: "Nginx p99 latency is higher than 3 seconds"
    - alert: NginxHighRequestRate
      expr: rate(nginx_ingress_controller_nginx_process_requests_total[5m]) * 100 > 1000
      for: 1m
      labels:
        severity: warning
      annotations:
        description: Nginx ingress controller high request rate ( instance {{ $labels.instance }} namespaces {{ $labels.namespaces }} pod {{$labels.pod}})
        summary: "Nginx ingress controller high request rate (> 1000 requests per second)"
    - alert: SSLCertificateExpiration15day
      expr: nginx_ingress_controller_ssl_expire_time_seconds < 1296000
      for: 30m
      labels:
        severity: warning
      annotations:
        summary: SSL/TLS certificate for {{ $labels.host $labels.secret_name }} is about to expire
        description: The SSL/TLS certificate for {{ $labels.host $labels.secret_name }} will expire in less than 15 days.
    - alert: SSLCertificateExpiration7day
      expr: nginx_ingress_controller_ssl_expire_time_seconds < 604800
      for: 30m
      labels:
        severity: critical
      annotations:
        summary: SSL/TLS certificate for {{ $labels.host $labels.secret_name }} is about to expire
        description: The SSL/TLS certificate for {{ $labels.host $labels.secret_name }} will expire in less than 7 days.
执行查询
[root@bt app]# kubectl apply -f  ingress_rule_yaml

[root@bt app]# kubectl get prometheusrules.monitoring.coreos.com  -n monitoring
NAME                              AGE
alertmanager-main-rules           24h
etcd-rules                        21h
kube-prometheus-rules             24h
kube-state-metrics-rules          24h
kubernetes-monitoring-rules       24h
nginx-ingress-rules               11s
node-exporter-rules               24h
prometheus-k8s-prometheus-rules   24h
prometheus-operator-rules         24h
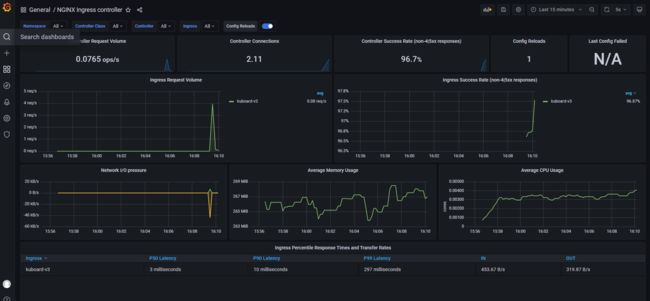
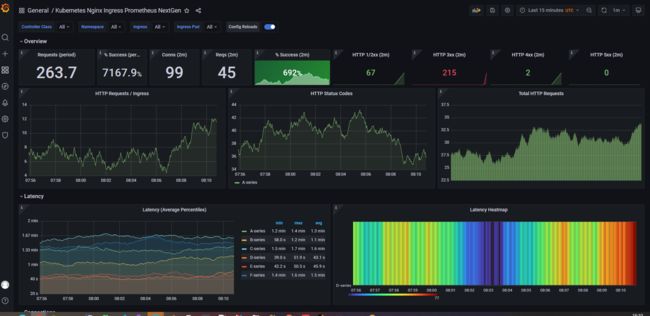
6、Grafan导入模版
Ingress-nginx模板ID:9614、14314
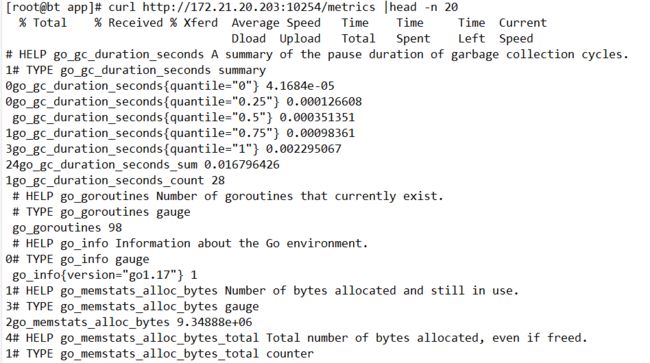
6、监控指标
curl http://172.21.20.203:10254/metrics
访问上面的接口,会返回监控指标,这写数据Prometheus会定时拉去。
接下来让我们看看这些数据的含义
curl http://172.21.20.203:10254/metrics | grep -Ev '^#' |awk -F '{' '{print $1}' | sort | uniq | awk '{print $1}'
[root@bt ~]# curl http://172.21.20.203:10254/metrics | grep -Ev '^#' |awk -F '{' '{print $1}' | sort | uniq | awk '{print $1}'
  % Total    % Received % Xferd  Average Speed   Time    Time     Time  Current
                                 Dload  Upload   Total   Spent    Left  Speed
100  291k    0  291k    0     0  6654k      0 --:--:-- --:--:-- --:--:-- 6781k
go_gc_duration_seconds
go_gc_duration_seconds_count
go_gc_duration_seconds_sum
go_goroutines
go_info
go_memstats_alloc_bytes
go_memstats_alloc_bytes_total
go_memstats_buck_hash_sys_bytes
go_memstats_frees_total
go_memstats_gc_cpu_fraction
go_memstats_gc_sys_bytes
go_memstats_heap_alloc_bytes
go_memstats_heap_idle_bytes
go_memstats_heap_inuse_bytes
go_memstats_heap_objects
go_memstats_heap_released_bytes
go_memstats_heap_sys_bytes
go_memstats_last_gc_time_seconds
go_memstats_lookups_total
go_memstats_mallocs_total
go_memstats_mcache_inuse_bytes
go_memstats_mcache_sys_bytes
go_memstats_mspan_inuse_bytes
go_memstats_mspan_sys_bytes
go_memstats_next_gc_bytes
go_memstats_other_sys_bytes
go_memstats_stack_inuse_bytes
go_memstats_stack_sys_bytes
go_memstats_sys_bytes
go_threads
nginx_ingress_controller_bytes_sent_bucket
nginx_ingress_controller_bytes_sent_count
nginx_ingress_controller_bytes_sent_sum
nginx_ingress_controller_config_hash
nginx_ingress_controller_config_last_reload_successful
nginx_ingress_controller_config_last_reload_successful_timestamp_seconds
nginx_ingress_controller_ingress_upstream_latency_seconds
nginx_ingress_controller_ingress_upstream_latency_seconds_count
nginx_ingress_controller_ingress_upstream_latency_seconds_sum
nginx_ingress_controller_leader_election_status
nginx_ingress_controller_nginx_process_connections
nginx_ingress_controller_nginx_process_connections_total
nginx_ingress_controller_nginx_process_cpu_seconds_total
nginx_ingress_controller_nginx_process_num_procs
nginx_ingress_controller_nginx_process_oldest_start_time_seconds
nginx_ingress_controller_nginx_process_read_bytes_total
nginx_ingress_controller_nginx_process_requests_total
nginx_ingress_controller_nginx_process_resident_memory_bytes
nginx_ingress_controller_nginx_process_virtual_memory_bytes
nginx_ingress_controller_nginx_process_write_bytes_total
nginx_ingress_controller_request_duration_seconds_bucket
nginx_ingress_controller_request_duration_seconds_count
nginx_ingress_controller_request_duration_seconds_sum
nginx_ingress_controller_requests
nginx_ingress_controller_request_size_bucket
nginx_ingress_controller_request_size_count
nginx_ingress_controller_request_size_sum
nginx_ingress_controller_response_duration_seconds_bucket
nginx_ingress_controller_response_duration_seconds_count
nginx_ingress_controller_response_duration_seconds_sum
nginx_ingress_controller_response_size_bucket
nginx_ingress_controller_response_size_count
nginx_ingress_controller_response_size_sum
nginx_ingress_controller_ssl_expire_time_seconds
nginx_ingress_controller_success
process_cpu_seconds_total
process_max_fds
process_open_fds
process_resident_memory_bytes
process_start_time_seconds
process_virtual_memory_bytes
process_virtual_memory_max_bytes
promhttp_metric_handler_requests_in_flight
promhttp_metric_handler_requests_total
[root@bt ~]#
参考文档:
https://help.aliyun.com/zh/arms/prometheus-monitoring/basic-metrics
https://www.volcengine.com/docs/6731/802251
上面go开头的不用管,这是监控软件自带监控本身数据指标的,我们重点关注下方的的指标数据
此处根据自己的整理,以及参考ChatGPT进行汇总,仅供参考
这些指标通过 Prometheus 暴露,并可以用于监控和告警:

nginx_ingress_controller_bytes_sent_bucket: 请求发送字节大小的分布情况(通常为直方图的一部分,用于计算请求字节量的分位数)。

nginx_ingress_controller_bytes_sent_count: 发送的总请求数量,每个请求发送的字节累加的总和。

nginx_ingress_controller_bytes_sent_sum: 发送的总字节量,累计所有请求发送的字节。

nginx_ingress_controller_config_hash: 当前Nginx配置的哈希值,可用来检测配置是否有变化。

nginx_ingress_controller_config_last_reload_successful: 标识最后一次重新加载Nginx配置是否成功(1表示成功,0表示失败)。

nginx_ingress_controller_config_last_reload_successful_timestamp_seconds: 最后一次成功重新加载Nginx配置的时间戳。

nginx_ingress_controller_ingress_upstream_latency_seconds: 记录从ingress到上游服务的延迟。

nginx_ingress_controller_ingress_upstream_latency_seconds_count: 上游服务延迟计数。

nginx_ingress_controller_ingress_upstream_latency_seconds_sum: 上游服务延迟总和。

nginx_ingress_controller_leader_election_status: 标识当前实例是否是领导者(leader election用于决定哪个Ingress controller实例是主控)。

nginx_ingress_controller_nginx_process_connections: Nginx进程当前的活跃连接数。

nginx_ingress_controller_nginx_process_connections_total: Nginx进程处理的总连接数。

nginx_ingress_controller_nginx_process_cpu_seconds_total: Nginx进程消耗的CPU时间总量。

nginx_ingress_controller_nginx_process_num_procs: Nginx进程数。

nginx_ingress_controller_nginx_process_oldest_start_time_seconds: 最老的Nginx进程启动时间。

nginx_ingress_controller_nginx_process_read_bytes_total: Nginx进程读操作的总字节数。

nginx_ingress_controller_nginx_process_requests_total: Nginx进程处理的总请求数量。

nginx_ingress_controller_nginx_process_resident_memory_bytes: Nginx进程的常驻内存大小。

nginx_ingress_controller_nginx_process_virtual_memory_bytes: Nginx进程的虚拟内存大小。

nginx_ingress_controller_nginx_process_write_bytes_total: Nginx进程写操作的总字节数。

nginx_ingress_controller_request_duration_seconds_bucket: 处理请求的持续时间的分布情况。

nginx_ingress_controller_request_duration_seconds_count: 请求持续时间的计数。

nginx_ingress_controller_request_duration_seconds_sum: 请求持续时间的总和。

nginx_ingress_controller_requests: 处理的总请求量。

nginx_ingress_controller_request_size_bucket: 请求大小的分布情况。

nginx_ingress_controller_request_size_count: 请求大小的计数。

nginx_ingress_controller_request_size_sum: 请求大小的总和。

nginx_ingress_controller_response_duration_seconds_bucket: 响应时间的分布情况。

nginx_ingress_controller_response_duration_seconds_count: 响应时间的计数。

nginx_ingress_controller_response_duration_seconds_sum: 响应时间的总和。

nginx_ingress_controller_response_size_bucket: 响应大小的分布情况。

nginx_ingress_controller_response_size_count: 响应大小的计数。

nginx_ingress_controller_response_size_sum: 响应大小的总和。

nginx_ingress_controller_ssl_expire_time_seconds: SSL证书到期时间。

nginx_ingress_controller_success: 成功处理的请求计数。

process_cpu_seconds_total: 进程消耗的CPU时间总量。

process_max_fds: 进程可以打开的最大文件描述符数量。

process_open_fds: 进程当前打开的文件描述符数量。

process_resident_memory_bytes: 进程的常驻内存大小。

process_start_time_seconds: 进程启动的开始时间。

process_virtual_memory_bytes: 进程的虚拟内存大小。

process_virtual_memory_max_bytes: 进程可以使用的最大虚拟内存大小。

promhttp_metric_handler_requests_in_flight: 当前正在处理的promhttp指标处理器的请求数量。

promhttp_metric_handler_requests_total: promhttp指标处理器处理的总请求数量。