RANSAC(Random sample consensus)随机抽样一致性
文章目录
-
- 1.算法介绍
- 2.实现过程
- 3.以直线拟合为例
- 4.直线的描述
- 5.源码
- 参考连接
1.算法介绍
RANSAC(Random Sample Consensus)是一种迭代的参数估计算法,用于从包含噪声和异常值的数据中拟合数学模型。它最初由Fischler和Bolles于1981年提出,被广泛应用于计算机视觉和计算机图形学等领域。
RANSAC的核心思想是随机选择数据中的一小部分样本,并根据这些样本拟合一个模型。然后,通过计算其他数据点到该模型的距离,并将距离小于一定阈值的数据点划分为内点,而距离大于阈值的数据点则划分为外点。重复此过程多次,并选择具有最多内点的模型作为最终的估计结果。
RANSAC算法的优点在于它对于大量异常值和噪声的数据有较好的鲁棒性。它可以估计出包含异常值的数据集中的准确模型,并且不要求事先知道异常值的数量,这种算法常被用于处理具有离群点或噪声的数据。
与最小二乘法相比,RANSAC的主要优点是对异常值的鲁棒性。最小二乘法试图最小化所有数据点的误差平方和,因此对异常值非常敏感。只要有一个数据点远离真实模型,就可能严重影响最小二乘法的结果。而RANSAC通过随机抽样和内点检测机制,能够有效地抵抗异常值的影响。
应用场景:
-
特征匹配:在图像配准和目标识别中,我们需要匹配两幅图像中的特征点。由于噪声和异常值的存在,直接匹配可能会得到错误的结果。RANSAC可以用于鲁棒地估计特征点之间的映射关系,从而提高匹配的准确性。
-
三维重建:在立体视觉和结构光扫描中,我们需要从多个视角的图像中重建三维结构。RANSAC可以用于估计相机的运动和场景的几何结构,从而实现鲁棒的三维重建。
-
运动估计:在视频分析和机器人导航中,我们需要估计物体或相机的运动。RANSAC可以用于从时间序列的图像数据中鲁棒地估计运动参数。
-
平面检测:在场景理解和物体检测中,我们需要从图像中检测平面。RANSAC可以用于从点云数据中鲁棒地检测平面。
-
校准:在相机校准和图像拼接中,我们需要估计图像之间的几何变换。RANSAC可以用于鲁棒地估计这些变换,从而实现准确的校准和拼接。
2.实现过程
下面的伪代码来源于维基百科,仔细读一下这份伪代码,它已经把算法的实现过程说的很明确了。
Given:
    data – A set of observations.
    model – A model to explain the observed data points.
    n – The minimum number of data points required to estimate the model parameters.
    k – The maximum number of iterations allowed in the algorithm.
    t – A threshold value to determine data points that are fit well by the model (inlier).
    d – The number of close data points (inliers) required to assert that the model fits well to the data.

Return:
    bestFit – The model parameters which may best fit the data (or null if no good model is found).


iterations = 0
bestFit = null
bestErr = something really large // This parameter is used to sharpen the model parameters to the best data fitting as iterations go on.

while iterations < k do
    maybeInliers := n randomly selected values from data
    maybeModel := model parameters fitted to maybeInliers
    confirmedInliers := empty set
    for every point in data do
        if point fits maybeModel with an error smaller than t then
             add point to confirmedInliers
        end if
    end for
    if the number of elements in confirmedInliers is > d then
        // This implies that we may have found a good model.
        // Now test how good it is.
        betterModel := model parameters fitted to all the points in confirmedInliers
        thisErr := a measure of how well betterModel fits these points
        if thisErr < bestErr then
            bestFit := betterModel
            bestErr := thisErr
        end if
    end if
    increment iterations
end while

return bestFit
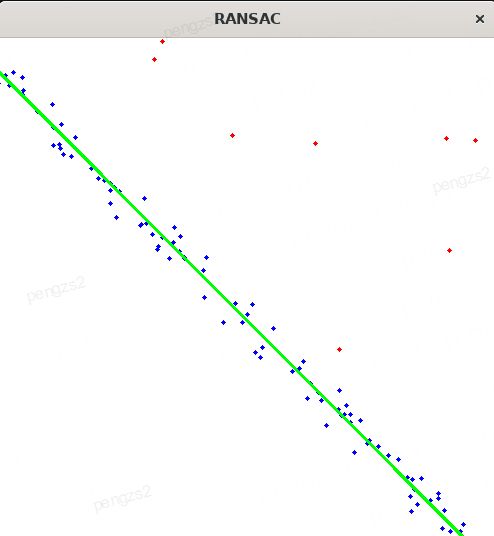
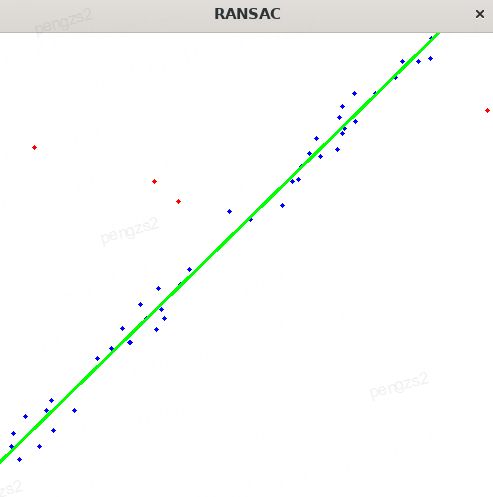
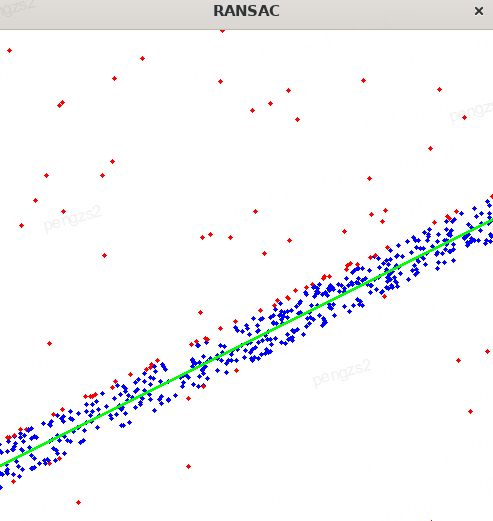
3.以直线拟合为例
随机构造一些散点,添加一部分噪声,用RANSAC的算法来拟合这些散点,结果示例如下:
4.直线的描述
假设我们有一个点 P ( x 0 , y 0 ) P(x_0, y_0) P(x0,y0)和一个法向量 N ( a , b ) N(a, b) N(a,b),那么直线的点法式方程可以表示为:
a ( x − x 0 ) + b ( y − y 0 ) = 0 a(x - x_0) + b(y - y_0) = 0 a(x−x0)+b(y−y0)=0
这个方程的含义是,对于直线上的任意一点 ( x , y ) (x, y) (x,y),它与点 P P P的向量 < P , ( x , y ) >
给定两个点 P 1 ( x 1 , y 1 ) , P 2 ( x 2 , y 2 ) P_1(x_1,y_1),P_2(x2,y_2) P1(x1,y1),P2(x2,y2),
-
直线的方向向量 D D D: D = ( x 2 − x 1 , y 2 − y 1 ) D=(x_2-x_1, y_2-y_1) D=(x2−x1,y2−y1)
-
直线的法向量 N N N: N = ( − ( y 2 − y 1 ) , x 2 − x 1 ) N=(-(y_2-y_1), x_2-x_1) N=(−(y2−y1),x2−x1)
将法向量 N N N和已知 P 1 P1 P1代入上面的方程,得到:
− ( y 2 − y 1 ) ( x − x 1 ) + ( x 2 − x 1 ) ( y − y 1 ) = 0 -(y_2 - y_1)(x - x_1) + (x_2 - x_1)(y - y_1) = 0 −(y2−y1)(x−x1)+(x2−x1)(y−y1)=0
然后,我们可以将这个方程进一步整理为一般式方程ax + by + c = 0的形式:
( y 1 − y 2 ) x + ( x 2 − x 1 ) y + ( x 1 y 2 − x 2 y 1 ) = 0 (y_1 - y_2)x + (x_2 - x_1)y + (x_1y_2 - x_2y_1) = 0 (y1−y2)x+(x2−x1)y+(x1y2−x2y1)=0
所以,一般式方程的系数 a = y 1 − y 2 , b = x 2 − x 1 , c = x 1 y 2 − x 2 y 1 a = y_1 - y_2,b = x_2 - x_1,c = x_1y_2 - x_2y_1 a=y1−y2,b=x2−x1,c=x1y2−x2y1。
点到直线的距离公式如下:
d = ∣ a x 0 + b y 0 + c ∣ ( a 2 + b 2 ) d = \frac{|ax_0 + by_0 + c|}{ \sqrt{(a^2 + b^2)}} d=(a2+b2)∣ax0+by0+c∣
有时候为了方便计算点到直线的距离,会对直线的一般式方程做归一化使得 a 2 + b 2 = 1 a^2+b^2=1 a2+b2=1这样上面的式子中分母项消失,变为 d = ∣ a x 0 + b y 0 + c ∣ d = |ax_0 + by_0 + c| d=∣ax0+by0+c∣。
5.源码
#include 参考连接
[1] Random sample consensus