【Copula】最可能场景详解
基于Copula联合分布的最可能场景详解
- 最可能场景(The most-likely scenario)
- 实例探讨
- 参考
最可能场景(The most-likely scenario)

相应英文介绍原理介绍如下:(出自论文J2020-Drought hazard transferability from meteorological to hydrological propagation)
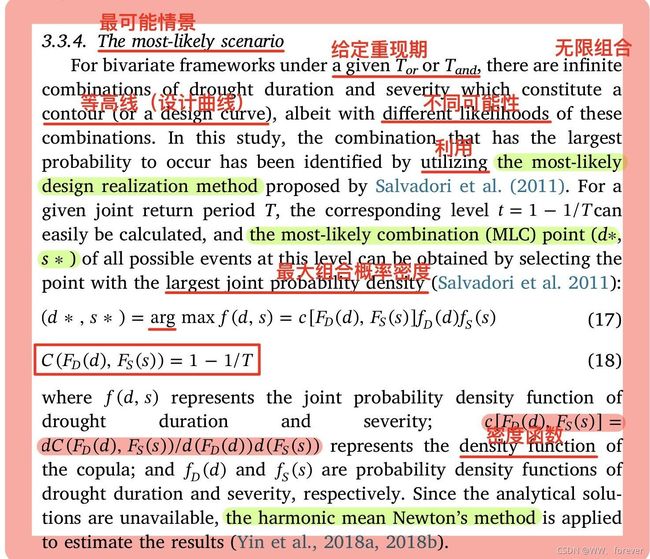
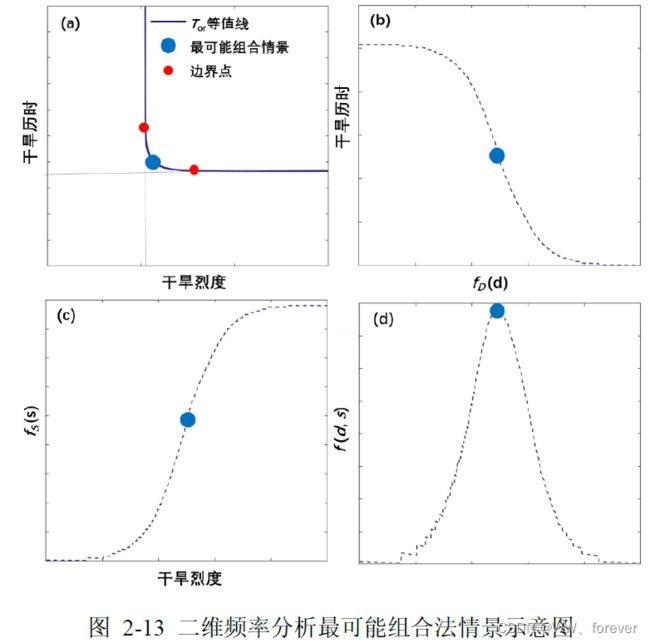
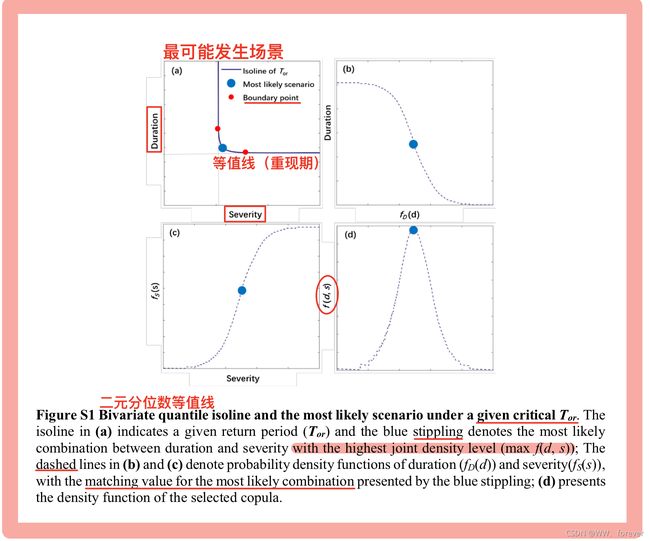
最可能组合点(the most-likely combination(MLE) point (d*,s*))绘制如下:(出自论文-J2021-Responses of Precipitation and Runoff to Climate Warming and Implications for Future Drought Changes in China)
实例探讨
根据我的算例,我的实现结果如下:

相应MATLAB绘图代码如下:
figure(1)
subplot(2,2,1)
hold on; box on;
contour(Yseries,Xseries,M',[2 2],'w');
DSS = GetContourMatrix(c,2);
h(2)=line( [ min(DSS{1,1}(2,:)) min(DSS{1,1}(2,:)) ],[ 50 200] ,'linestyle','--', 'Color',[0.4118 0.4118 0.4118], 'LineWidth', 1);
h(3)=line( [ 0.5 1.8] ,[ min(DSS{1,1}(1,:)) min(DSS{1,1}(1,:)) ] ,'linestyle','--', 'Color',[0.4118 0.4118 0.4118], 'LineWidth', 1);
[~,h(1)] = contour(Yseries,Xseries,M',[2 2],'k');
h(1).LineWidth = 1.5;
h(4)=plot(MLC(1,2),MLC(1,1), 'r.','markersize',25);
axis([ 0.5 1.75 50 190 ]);
xlabel("Severity");
ylabel("Duration");
hl = legend(h([1 4 ]),"Isoline of T_o_r","Most likely scenario");
set(hl,'Box','off');

subplot(2,2,2)
hold on; box on;
plot(ff1{1,1},aaa{1,1},'k:','linewidth',1.5);
index = find(aaa{1,1}==MLC(1,1));
plot(ff1{1,1}(index),aaa{1,1}(index),'r.','markersize',25);
axis([ 0 0.01 50 190  ]);
xlabel("f_D(d)");
ylabel("Duration");

subplot(2,2,3)
hold on; box on;
plot(bbb{1,1},ff2{1,1},'k:','linewidth',1.5);
index = find(bbb{1,1}==MLC(1,2));
plot( bbb{1,1}(index),ff2{1,1}(index),'r.','markersize',25 );
axis([ 0.5 1.75 0 2.2]);
xlabel("Severity");
ylabel("f_S(s)");

subplot(2,2,4)
hold on; box on;
plot(1:length(UVYFrank{1,1}),UVYFrank{1,1},'k:','linewidth',1.5);
index = find(bbb{1,1}==MLC(1,2));
plot( index ,UVYFrank{1,1}(index),'r.','markersize',25 );
ylabel("f(d,s)");
太离谱了,两年前画的图学的方法现在不知道咋做的了!这说明什么?需要良好的习惯记录学会的东西!
参考
1、科研论文-
2、博士论文-D2020-气候变化对干旱的影响及风险传播-顾磊