nagios部署记录
nagios主程序部署
前期准备工作


#关闭防火墙
systemctl stop firewalld
#关闭防火墙开启自启
systemctl disable firewalld

vi /etc/sysconfig/selinux
SELINUX=disabled
#重启

#换源
cd /etc/yum.repos.d/
#备份源
mv CentOS-Base.repo CentOS-Base.repo.bak
#下载阿里源
curl -o /etc/yum.repos.d/CentOS-Base.repo http://mirrors.aliyun.com/repo/Centos-7.repo

#清除缓存
yum clean all
#生成缓存
yum makecache


#正式开始
#系统:centos7

#安装扩展源
yum install -y epel-release
#安装nagios、插件、制图软件
yum install -y nagios nagios-plugins-all nagios-plugins-nt pnp4nagios

#启动nagios
systemctl start nagios
#启动web端,默认用户密码都是nagiosadmin
systemctl start httpd
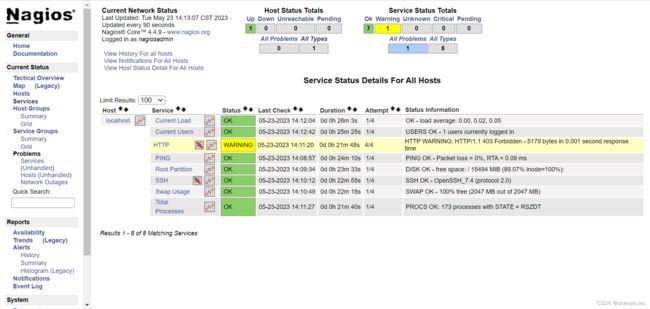
登录 http://IP地址/nagios/ 默认用户密码都是nagiosadmin

pnp4nagios图形生成
我们选择 Bulk Mode with NPCD 这种模式
找到这个文件/etc/pnp4nagios/nagios.cfg 将Bulk / NPCD mode模式下的内容复制出来

#############################
#
# Bulk / NPCD mode
#

process_performance_data=1

# *** the template definition differs from the one in the original nagios.cfg
#
service_perfdata_file=/var/log/pnp4nagios/service-perfdata
service_perfdata_file_template=DATATYPE::SERVICEPERFDATA\tTIMET::$TIMET$\tHOSTNAME::$HOSTNAME$\tSERVICEDESC::$SERVICEDESC$\tSERVICEPERFDATA::$SERVICEPERFDATA$\tSERVICECHECKCOMMAND::$SERVICECHECKCOMMAND$\tHOSTSTATE::$HOSTSTATE$\tHOSTSTATETYPE::$HOSTSTATETYPE$\tSERVICESTATE::$SERVICESTATE$\tSERVICESTATETYPE::$SERVICESTATETYPE$
service_perfdata_file_mode=a
service_perfdata_file_processing_interval=15
service_perfdata_file_processing_command=process-service-perfdata-file

# *** the template definition differs from the one in the original nagios.cfg
#
host_perfdata_file=/var/log/pnp4nagios/host-perfdata
host_perfdata_file_template=DATATYPE::HOSTPERFDATA\tTIMET::$TIMET$\tHOSTNAME::$HOSTNAME$\tHOSTPERFDATA::$HOSTPERFDATA$\tHOSTCHECKCOMMAND::$HOSTCHECKCOMMAND$\tHOSTSTATE::$HOSTSTATE$\tHOSTSTATETYPE::$HOSTSTATETYPE$
host_perfdata_file_mode=a
host_perfdata_file_processing_interval=15
host_perfdata_file_processing_command=process-host-perfdata-file

#
#######################

放到vi /etc/nagios/nagios.cfg 添加到文件末尾

-------------------------------------------------------------

找到这个文件/etc/pnp4nagios/misccommands.cfg 将下面内容复制出来

###########################
# Bulk with NPCD mode
#
#define command {
#       command_name    process-service-perfdata-file
#       command_line    /bin/mv /var/log/pnp4nagios/service-perfdata /var/spool/pnp4nagios/service-perfdata.$TIMET$
#}

#define command {
#       command_name    process-host-perfdata-file
#       command_line    /bin/mv /var/log/pnp4nagios/host-perfdata /var/spool/pnp4nagios/host-perfdata.$TIMET$
#}
##############################

放到这个文件末尾/etc/nagios/objects/commands.cfg

systemctl restart nagios
systemctl restart httpd
systemctl restart npcd

重启上面三个服务,查询下面目录中是否有对应文件,有的话就说明成功了
等一分钟再查一下
如果还没有那就再重启上面三个服务
[root@localhost pnp4nagios]# ll /var/lib/pnp4nagios/localhost/
total 1140
-rw-rw-r-- 1 nagios nagios 384952 May 23 13:59 Root_Partition.rrd
-rw-rw-r-- 1 nagios nagios   1973 May 23 13:59 Root_Partition.xml
-rw-rw-r-- 1 nagios nagios 384952 May 23 14:00 SSH.rrd
-rw-rw-r-- 1 nagios nagios   1887 May 23 14:00 SSH.xml
-rw-rw-r-- 1 nagios nagios 384952 May 23 14:01 Swap_Usage.rrd
-rw-rw-r-- 1 nagios nagios   1939 May 23 14:01 Swap_Usage.xml
访问这个地址 http://IP地址/pnp4nagios 默认用户密码都是nagiosadmin
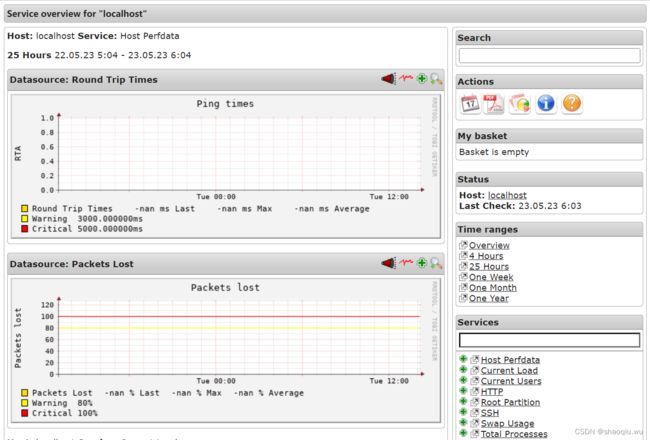
pnp4nagios主页图形生成
vim /etc/nagios/objects/templates.cfg
将以下代码添加到模板文件末端
#############################
define host {
   name       host-pnp
   action_url /pnp4nagios/index.php/graph?host=$HOSTNAME$&srv=_HOST_
   register   0
}

define service {
   name       service-pnp
   action_url /pnp4nagios/index.php/graph?host=$HOSTNAME$&srv=$SERVICEDESC$
   register   0
}
##############################
然后templates.cfg文件中的找到generic-host、generic-service
define host {

    name                            generic-host
    use                             host-pnp  #添加的内容
    。。。。。。
}

define service {

    name                            generic-service
    use                             service-pnp   #添加的内容
    。。。。。。。
}

保存!!
systemctl restart nagios
systemctl restart httpd
systemctl restart npcd
登录 http://IP地址/nagios/ 主页面也有图形标识
设置开机自启
systemctl enable nagios
systemctl enable httpd
systemctl enable npcd
监控windows
服务端配置
#安装插件

vim /etc/nagios/objects/windows.cfg
###################################
# 添加主机
define host {

    use                     windows-server
    host_name               winserver
    alias                   My Windows Server
    address                 192.168.1.100
}
# 加入组
define hostgroup {

    hostgroup_name          windows-servers
    alias                   Windows Servers
}
#需要监控的服务
define service {

    use                     generic-service
    host_name               winserver
    service_description     NSClient++ Version
    check_command           check_nt!CLIENTVERSION
}
##########################

vim /etc/nagios/nagios.cfg

# cfg_file=/etc/nagios/objects/windows.cfg
修改为
cfg_file=/etc/nagios/objects/windows.cfg

systemctl restart nagios
systemctl restart httpd
systemctl restart npcd
客户端

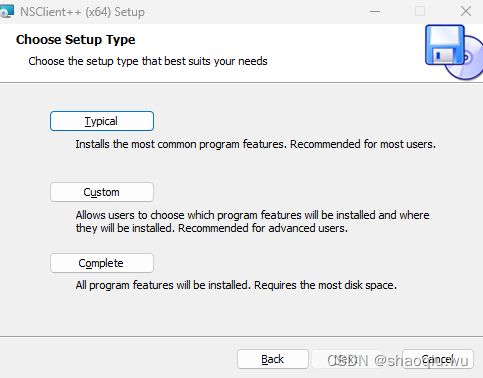

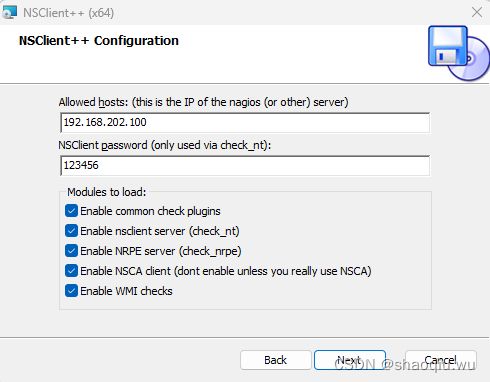
客户端配置完成
linux监控项目添加
# 服务端配置
yum install nagios-plugins-nrpe
yum install nrpe

vim /etc/nagios/objects/commands.cfg

##########################
# 添加命令
define command{
    command_name check_nrpe
    command_line $USER1$/check_nrpe -H $HOSTADDRESS$ -c $ARG1$
}

define command{
        command_name    check_mem
        command_line    $USER1$/check_nrpe -H $HOSTADDRESS$ -c check_mem
}

define command{
        command_name    check_cpu
        command_line    $USER1$/check_nrpe -H $HOSTADDRESS$ -c check_cpu
}
#####################3


# 被监控端配置
yum install nrpe

# 添加监控项
vim /etc/nagios/nrpe.cfg

############
command[check_mem]=/usr/lib64/nagios/plugins/check_mem.sh -w 80 -c 90
command[check_cpu]=/usr/lib64/nagios/plugins/check_cpu.sh -w 80 -c 90
############

# 创建内存监控脚本
vim /usr/lib64/nagios/plugins/check_mem.sh

#########################
#!/bin/bash

# Get total memory and free memory
TOTAL=`free -m | grep Mem | awk '{print $2}'`
FREE=`free -m | grep Mem | awk '{print $4}'`

# Calculate memory usage percentage
USED=`echo "scale=2; 100 - (($FREE/$TOTAL) * 100)" | bc`

# Check memory usage against warning and critical thresholds
if [ $USED -ge $1 ] && [ $USED -lt $2 ]; then
    echo "WARNING - Memory usage is at ${USED}%"
    exit 1
elif [ $USED -ge $2 ]; then
    echo "CRITICAL - Memory usage is at ${USED}%"
    exit 2
else
    echo "OK - Memory usage is at ${USED}%"
    exit 0
fi
########################33


# 创建cpu监控脚本
vim /usr/lib64/nagios/plugins/check_cpu.sh

###########################
#!/bin/bash

# Get CPU usage percentage
CPU=`top -bn1 | grep load | awk '{printf "%.2f%%\n", $(NF-2)}'`

# Remove '%' sign from CPU usage
CPU=${CPU%?}

# Check CPU usage against warning and critical thresholds
if [ ${CPU%.*} -ge $1 ] && [ ${CPU%.*} -lt $2 ]; then
    echo "WARNING - CPU usage is at ${CPU}"
    exit 1
elif [ ${CPU%.*} -ge $2 ]; then
    echo "CRITICAL - CPU usage is at ${CPU}"
    exit 2
else
    echo "OK - CPU usage is at ${CPU}"
    exit 0
fi
#################33333333


sudo chmod +x /usr/lib64/nagios/plugins/check_mem.sh
sudo chmod +x /usr/lib64/nagios/plugins/check_cpu.sh

systemctl start nrpe
systemctl enable nrpe