SpringBoot+Prometheus+Grafana搭建应用监控系统
1.应用监控系统介绍
SpringBoot的应用监控方案比较多,SpringBoot+Prometheus+Grafana是比较常用的一种解决方案,主要的监控数据的处理逻辑如下:
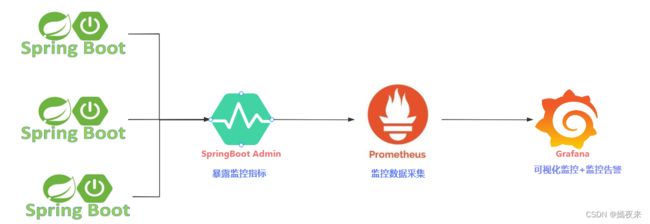
- SpringBoot 的 actuator 提供了应用监控端点,可以对外暴露监控数据信息。
- Prometheus 是监控系统,可以从 Springboot 采集监控数据,以时序数据的形式存储,并对外提供了监控数据查询服务。
- Grafana 是专业的 UI 仪表盘系统,支持非常多的数据源,自然也支持Prometheus,可以对接Prometheus,从其中获取数据,使用仪表盘展示出来。
springboot 2.X 中引入了 micrometer,它可以更方便的对接各种监控系统,包括 Prometheus。
2.软件版本说明
- jdk >= 1.8.0
- springboot == 2.7.11
- prometheus == 2.45.2
- grafana == 10.1.0
3. 准备SpringBoot项目
创建一个Springboot项目, SpringBoot版本选择2.7.11, 项目的pom.xml文件如下:
<project xmlns="http://maven.apache.org/POM/4.0.0"
         xmlns:xsi="http://www.w3.org/2001/XMLSchema-instance"
         xsi:schemaLocation="http://maven.apache.org/POM/4.0.0 http://maven.apache.org/xsd/maven-4.0.0.xsd">

    <modelVersion>4.0.0modelVersion>

	<groupId>com.beyondgroupId>
    <artifactId>beyond-monitor-adminartifactId>
	 <packaging>jarpackaging>

	 <name>beyond-monitor-adminname>
    <description>Demo project for Spring Bootdescription>

	 <properties>
        <springboot.version>2.7.11springboot.version>
		<prometheus.version>1.9.10prometheus.version>
    properties>

    <dependencies>

        <dependency>
            <groupId>org.springframework.bootgroupId>
            <artifactId>spring-boot-starter-webartifactId>
        dependency>


        <dependency>
            <groupId>org.springframework.bootgroupId>
            <artifactId>spring-boot-starter-actuatorartifactId>
        dependency>


        <dependency>
            <groupId>io.micrometergroupId>
            <artifactId>micrometer-registry-prometheusartifactId>
			<version>${prometheus.version}version>
        dependency>
    dependencies>


    <dependencyManagement>
        <dependencies>

            <dependency>
                <groupId>org.springframework.bootgroupId>
                <artifactId>spring-boot-dependenciesartifactId>
                <version>${spring-boot.version}version>
                <type>pomtype>
                <scope>importscope>
            dependency>
        dependencies>
	dependencyManagement>

    <build>
        <finalName>${project.artifactId}finalName>
        <plugins>
            <plugin>
                <groupId>org.springframework.bootgroupId>
                <artifactId>spring-boot-maven-pluginartifactId>
                <version>${spring-boot.version}version>
                <configuration>
                    <fork>truefork>
                configuration>
                <executions>
                    <execution>
                        <goals>
                            <goal>repackagegoal>
                        goals>
                    execution>
                executions>
            plugin>
        plugins>
    build>
project>
配置文件application.yml文件配置如下:
server:
  port: 19090
spring:
  application:
    name: beyond-monitor-admin
  profiles:
    active: dev

logging:
  config: classpath:logback-plus.xml

--- # Actuator 监控端点的配置项
management:
  endpoints:
    enabled-by-default: true #暴露所有端点信息
    web:
      exposure:
		# 这里可以指定暴露端点的范围,示例: health,info,env,prometheus,metrics,httptrace,threaddump,heapdump,springmetrics
        include: '*'
  endpoint:
    health:
      show-details: ALWAYS
    logfile:
      external-file: ./logs/beyond-monitor-admin.log
启动程序,访问http://localhost:19090/actuator/prometheus就可以看到服务暴露的那些监控指标了。
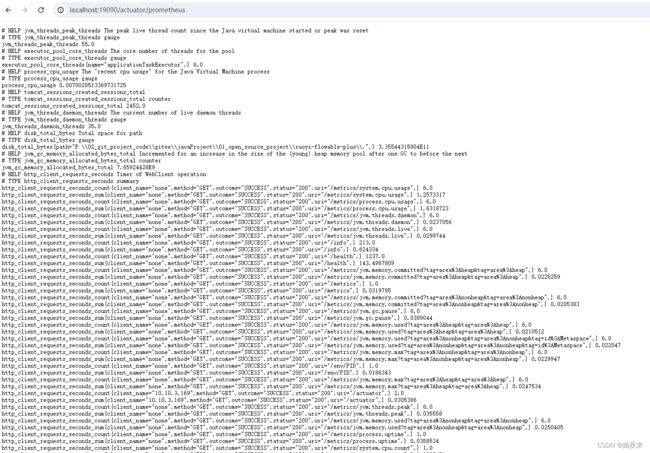
OK, 这样我们的web项目配置暴露监控指标就配置好了, 下面我们继续进行Prometheus和Grafana的安装。
4.应用安装
4.1.Prometheus下载安装
本文下载的是linux版本的最新稳定版本prometheus-2.45.2.linux-amd64.tar.gz。
下载地址:https://prometheus.io/download/
下载prometheus-2.45.2linux系统64位的安装压缩包,上传到服务器。
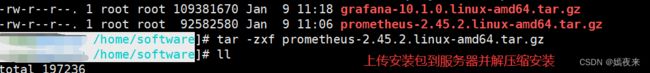
将上传的安装压缩包解压缩到指定的安装目录下
重命名应用名称为prometheus-2.45.2, 个人习惯, 可以跳过。


通过以上步骤,prometheus-2.45.2就安装好了。
4.2.Grafana下载安装
本文下载的是linux版本的最新稳定版本grafana-10.1.0.linux-amd64.tar.gz。
下载地址:https://grafana.com/grafana/download

下载grafana-10.1.0linux系统64位的安装压缩包,上传到服务器。
将上传的安装压缩包解压缩到指定的安装目录下
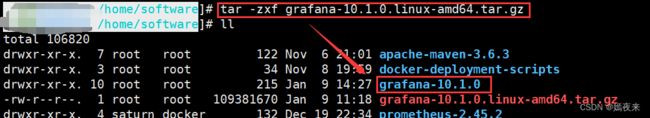
通过以上步骤,grafana-10.1.0就安装好了。
5.Prometheus配置启动
因为我们需要使用Prometheus从Springboot应用暴露的监控指标中进行数据采集,所以需要再Prometheus的配置文件prometheus.yml文件中配置数据采集的目标信息。

vim prometheus.yml
# my global config
global:
  scrape_interval: 15s # Set the scrape interval to every 15 seconds. Default is every 1 minute.
  evaluation_interval: 15s # Evaluate rules every 15 seconds. The default is every 1 minute.
  # scrape_timeout is set to the global default (10s).

# Alertmanager configuration
alerting:
  alertmanagers:
    - static_configs:
        - targets:
          # - alertmanager:9093

# Load rules once and periodically evaluate them according to the global 'evaluation_interval'.
rule_files:
  # - "first_rules.yml"
  # - "second_rules.yml"

# A scrape configuration containing exactly one endpoint to scrape:
# Here it's Prometheus itself.
scrape_configs:
  # The job name is added as a label `job=` to any timeseries scraped from this config.
  - job_name: "prometheus"

    # metrics_path defaults to '/metrics'
    # scheme defaults to 'http'.

    static_configs:
      - targets: ["localhost:9090"]

  # 配置应用监控服务的相关信息, prometheus会从配置的应用服务暴露的监控端点获取监控数据,如果有多个应用可以配置多个job
  - job_name: 'beyond-monitor-admin'
    scrape_interval: 5s # 刮取的时间间隔
    scrape_timeout: 5s
    metrics_path: /actuator/prometheus
    scheme: http
    #basic_auth: #认证信息(如果上线生产环境,admin项目最好配置安全认证, 这里配置认证账号和密码)
    #  username: admin
    #  password: admin
    static_configs:
      - targets: ["10.10.3.169:19090"]  #此处填写 Spring Boot 应用的 IP + 端口号
更多配置信息请查看官方文档prometheus配置。
现在可以启动Prometheus了,启动命令如下:
./prometheus --config.file=prometheus.yml
如下图:说明启动成功

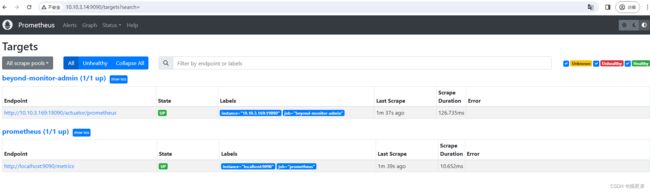
访问http://10.10.3.14:9090/targets,将IPt替换成你的Prometheus服务所在那台机器的IP,查看Spring Boot采集状态是否正常,如下图,说明Prometheus对接你的web应用成功,可以成功采集到监控信息。
6.Grafana配置启动
6.1.启动Grafana服务

# 进入到grafana的安装目录下的bin目录
cd /home/software/grafana-10.1.0/bin
# 启动grafana-server服务
nohup ./grafana-server &
当然你也可以直接将grafana-server配置到系统环境变量, 方便随时启动不用切换路径到grafana的安装目录下的bin目录,这个可以自行操作。
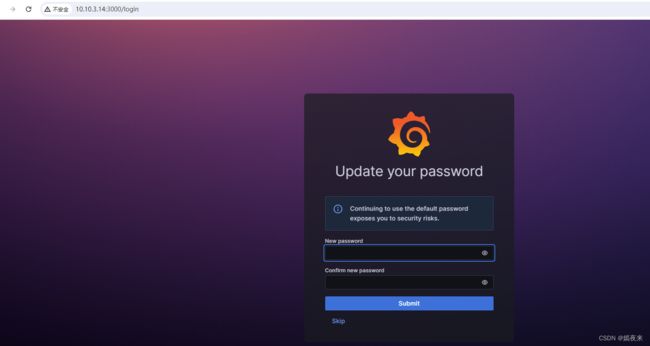
通过浏览器访问grafana服务,http://10.10.3.14:3000, 默认的登录账号密码是
账号:
admin
密码:admin

使用默认账号密码登录成功过之后,系统要求立即修改密码,如下图:
修改密码保存之后就进入系统首页了

6.2.配置Grafana可视化图表
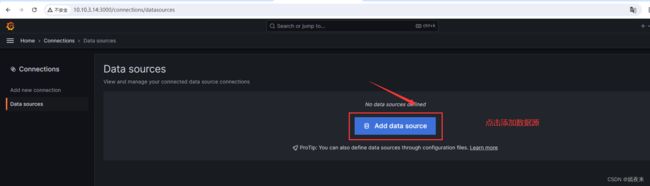
6.2.1.配置数据源
在配置Grafana可视化图表之前需要先配置数据源, Grafana支持很多种数据源对接,这里我们配置
Prometheus数据源。
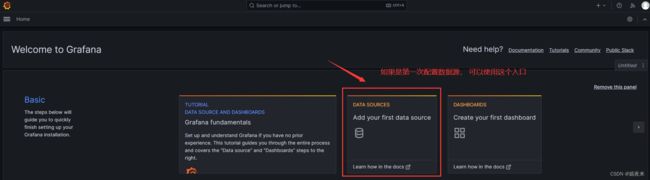
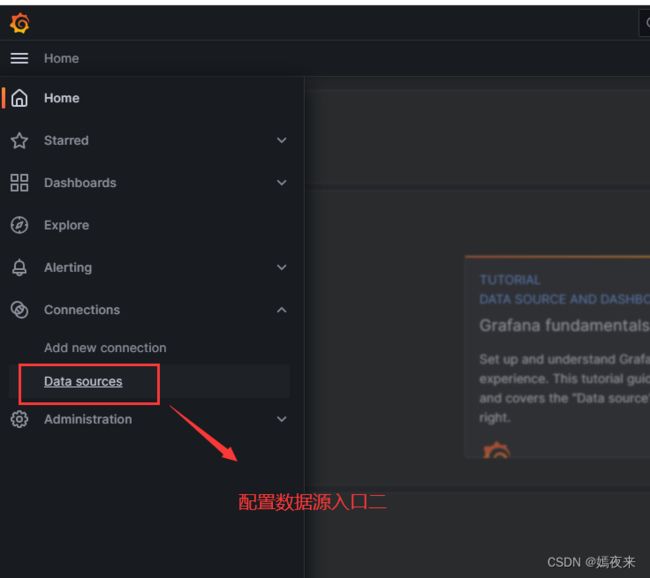
点击添加数据源
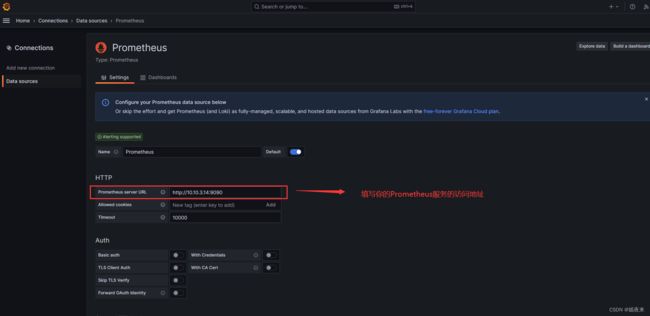
选择Prometheus数据源

配置Prometheus的应用访问URL地址信息

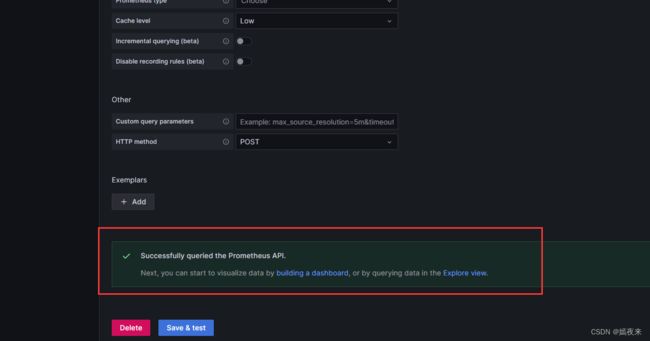
如下图:说明数据源配置正常可访问, 如果失败, 大概率就是以下几种情况导致的:
- Prometheus服务未正常启动
- Prometheus服务url信息配置填写错误
- 两个服务安装在不同的服务器,主机之间的网络不通
- 两个服务安装在不同的服务器,防火墙服务启动,服务无法通信
一般错误就是这几种情况,一一排查基本就能解决。
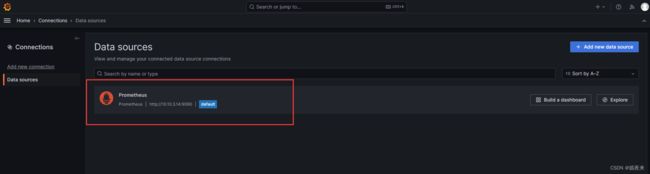
之后再数据源列表就可以看到我们配置的Prometheus数据源
6.2.2.配置可视化监控面板
对于这块儿, 我是真不擅长, 但是Grafana有一个网站上提供了免费的可视化模板可以下载, 访问地址是:https://grafana.com/grafana/dashboards/

这里我们搜索Spring,
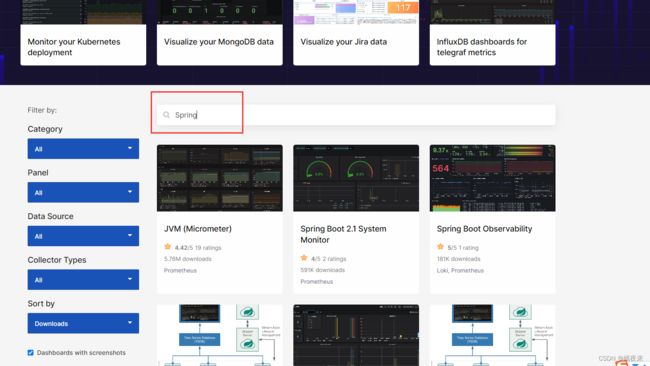
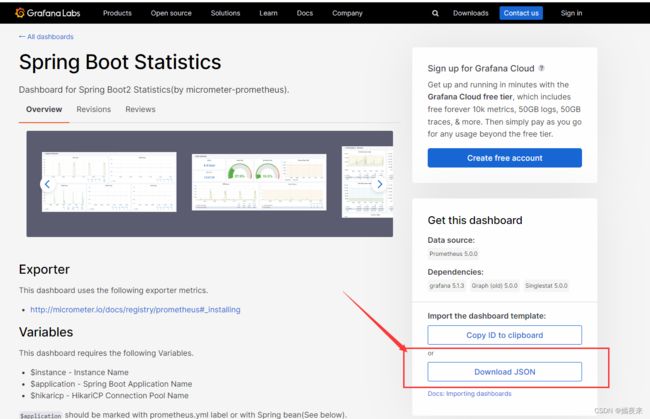
找一个你喜欢的模板, 点击Download JSON

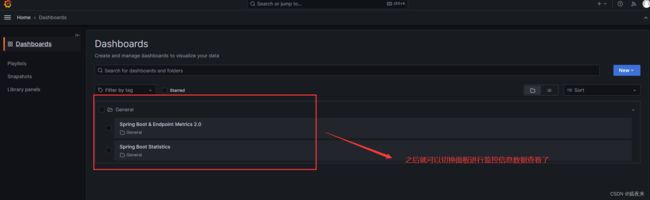
然后再Grafana上点击Dashboards菜单。如下图:

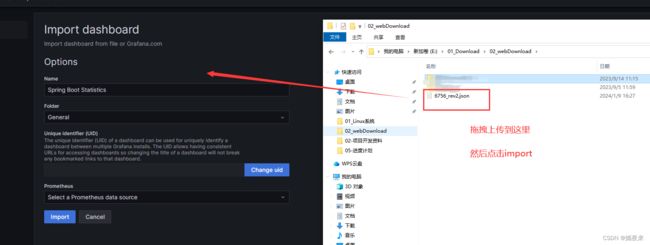
选择从外部导入

上传可视化面板的JSON文件并导入

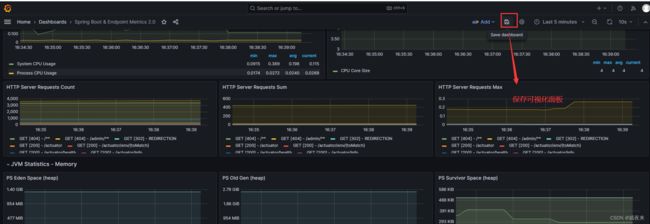
载入可视化面板模板如下:

保存可视化面板
可视化面板入口一
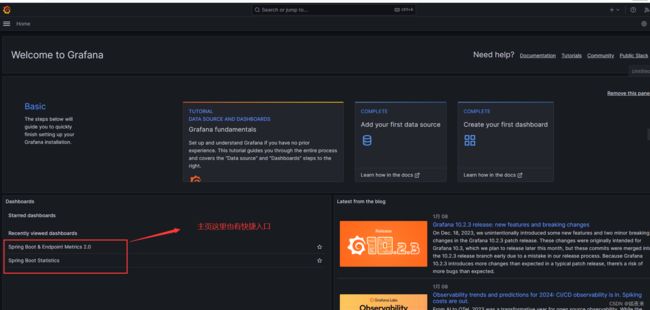
可视化面板入口二
通过以上操作, 我们的SpringBoot+Prometheus+Grafana搭建应用监控系统就搭建起来了。
好了,本篇文章到此结束,如果安装搭建过程中遇到问题,欢迎留言讨论哈,最后如果文章对你有帮助,请点赞关注,送你一朵小红花,谢谢~~~。