科研笔记第7期——Matlab 绘制局部放大图
目录
步骤(1)
步骤(2)
步骤(3)
步骤(4)
步骤(5)
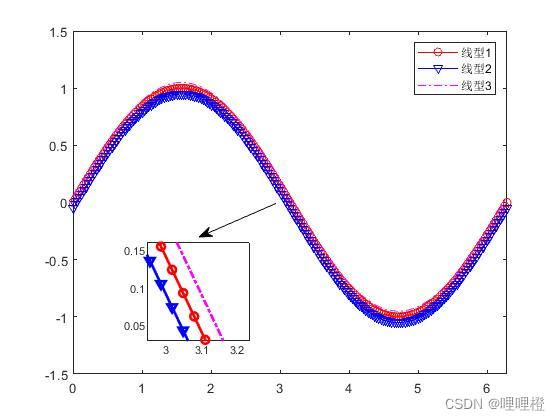
在写作论文时,经常需要对不同方法(仅有略微差别)进行比较,此时需要局部放大图发挥作用。
绘制局部放大图步骤可分为以下几个步骤:
步骤(1)
生成figure结果图
x = 0:pi/100:2*pi;
y1 = sin(x);
plot(x,y1,'r-o');
hold on
y2=sin(x)-0.05;
y3=sin(x)+0.05;
xlim([0 2*pi]);
ylim([-1.5 1.5]);
plot(x,y2,'b-v');
plot(x,y3,'m-.');
legend('线型1','线型2','线型3','Location','northeast')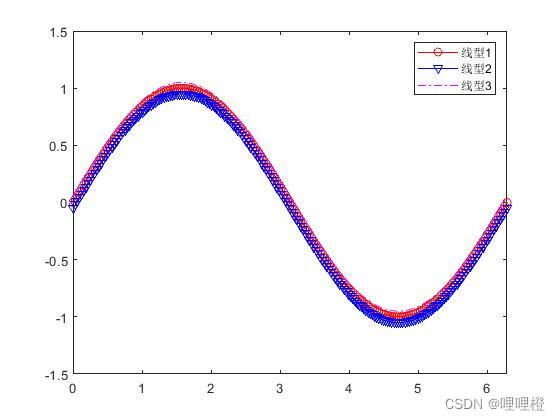
步骤(2)
输入magnify并运行(magnify.m和生成figure结果图的m文件放在同一文件夹下)可在matlab官网下载
function magnify(f1)
%
%magnify(f1)
%
% Figure creates a magnification box when under the mouse
% position when a button is pressed. Press '+'/'-' while
% button pressed to increase/decrease magnification. Press
% '>'/'<' while button pressed to increase/decrease box size.
% Hold 'Ctrl' while clicking to leave magnification on figure.
%
% Example:
% plot(1:100,randn(1,100),(1:300)/3,rand(1,300)), grid on,
% magnify;
% Rick Hindman - 7/29/04
if (nargin == 0), f1 = gcf; end;
set(f1, ...
'WindowButtonDownFcn', @ButtonDownCallback, ...
'WindowButtonUpFcn', @ButtonUpCallback, ...
'WindowButtonMotionFcn', @ButtonMotionCallback, ...
'KeyPressFcn', @KeyPressCallback);
return;
function ButtonDownCallback(src,eventdata)
f1 = src;
a1 = get(f1,'CurrentAxes');
a2 = copyobj(a1,f1);
set(f1, ...
'UserData',[f1,a1,a2], ...
'Pointer','fullcrosshair', ...
'CurrentAxes',a2);
set(a2, ...
'UserData',[2,0.2], ... %magnification, frame size
'Color',get(a1,'Color'), ...
'Box','on');
xlabel(''); ylabel(''); zlabel(''); title('');
set(get(a2,'Children'), ...
'LineWidth', 2);
set(a1, ...
'Color',get(a1,'Color')*0.95);
set(f1, ...
'CurrentAxes',a1);
ButtonMotionCallback(src);
return;
function ButtonUpCallback(src,eventdata)
H = get(src,'UserData');
f1 = H(1); a1 = H(2); a2 = H(3);
set(a1, ...
'Color',get(a2,'Color'));
set(f1, ...
'UserData',[], ...
'Pointer','arrow', ...
'CurrentAxes',a1);
if ~strcmp(get(f1,'SelectionType'),'alt'),
delete(a2);
end;
return;
function ButtonMotionCallback(src,eventdata)
H = get(src,'UserData');
if ~isempty(H)
f1 = H(1); a1 = H(2); a2 = H(3);
a2_param = get(a2,'UserData');
f_pos = get(f1,'Position');
a1_pos = get(a1,'Position');
[f_cp, a1_cp] = pointer2d(f1,a1);
set(a2,'Position',[(f_cp./f_pos(3:4)) 0 0]+a2_param(2)*a1_pos(3)*[-1 -1 2 2]);
a2_pos = get(a2,'Position');
set(a2,'XLim',a1_cp(1)+(1/a2_param(1))*(a2_pos(3)/a1_pos(3))*diff(get(a1,'XLim'))*[-0.5 0.5]);
set(a2,'YLim',a1_cp(2)+(1/a2_param(1))*(a2_pos(4)/a1_pos(4))*diff(get(a1,'YLim'))*[-0.5 0.5]);
end;
return;
function KeyPressCallback(src,eventdata)
H = get(gcf,'UserData');
if ~isempty(H)
f1 = H(1); a1 = H(2); a2 = H(3);
a2_param = get(a2,'UserData');
if (strcmp(get(f1,'CurrentCharacter'),'+') | strcmp(get(f1,'CurrentCharacter'),'='))
a2_param(1) = a2_param(1)*1.2;
elseif (strcmp(get(f1,'CurrentCharacter'),'-') | strcmp(get(f1,'CurrentCharacter'),'_'))
a2_param(1) = a2_param(1)/1.2;
elseif (strcmp(get(f1,'CurrentCharacter'),'<') | strcmp(get(f1,'CurrentCharacter'),','))
a2_param(2) = a2_param(2)/1.2;
elseif (strcmp(get(f1,'CurrentCharacter'),'>') | strcmp(get(f1,'CurrentCharacter'),'.'))
a2_param(2) = a2_param(2)*1.2;
end;
set(a2,'UserData',a2_param);
ButtonMotionCallback(src);
end;
return;
% Included for completeness (usually in own file)
function [fig_pointer_pos, axes_pointer_val] = pointer2d(fig_hndl,axes_hndl)
%
%pointer2d(fig_hndl,axes_hndl)
%
% Returns the coordinates of the pointer (in pixels)
% in the desired figure (fig_hndl) and the coordinates
% in the desired axis (axes coordinates)
%
% Example:
% figure(1),
% hold on,
% for i = 1:1000,
% [figp,axp]=pointer2d;
% plot(axp(1),axp(2),'.','EraseMode','none');
% drawnow;
% end;
% hold off
% Rick Hindman - 4/18/01
if (nargin == 0), fig_hndl = gcf; axes_hndl = gca; end;
if (nargin == 1), axes_hndl = get(fig_hndl,'CurrentAxes'); end;
set(fig_hndl,'Units','pixels');
pointer_pos = get(0,'PointerLocation'); %pixels {0,0} lower left
fig_pos = get(fig_hndl,'Position'); %pixels {l,b,w,h}
fig_pointer_pos = pointer_pos - fig_pos([1,2]);
set(fig_hndl,'CurrentPoint',fig_pointer_pos);
if (isempty(axes_hndl)),
axes_pointer_val = [];
elseif (nargout == 2),
axes_pointer_line = get(axes_hndl,'CurrentPoint');
axes_pointer_val = sum(axes_pointer_line)/2;
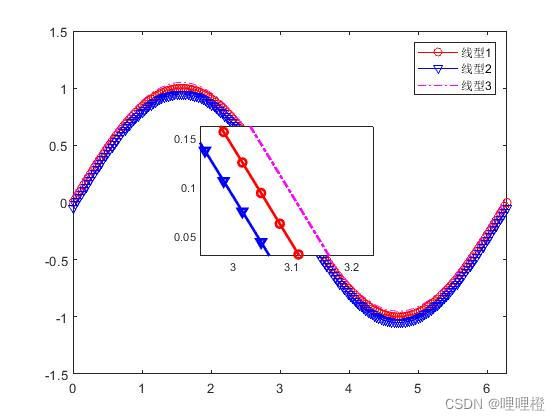
end;步骤(3)
在结果图中点击鼠标右键,即可放大右键所在区域图像。此时按住右键不放,ctrl键和+号可以继续放大局部图像,如下图
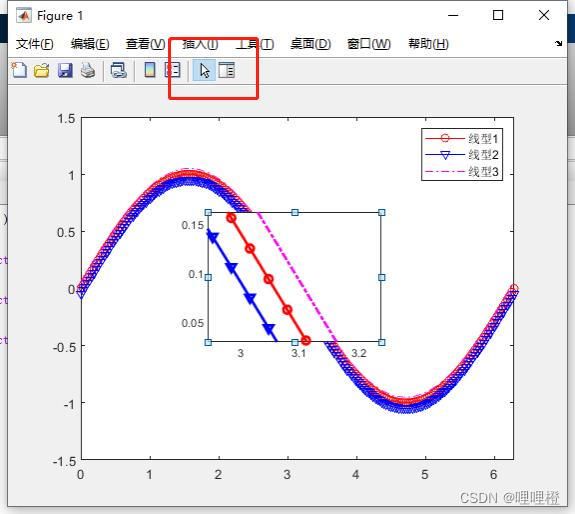
步骤(4)
移动局部放大区域的位置、对局部放大区域放大放小。
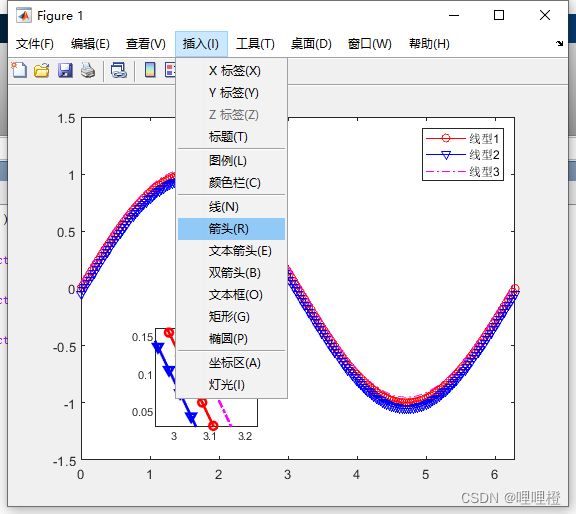
步骤(5)
插入箭头
参考文献
[1]如何放大matlab结果局部图_matlab局部放大图_苏苏的水蜜桃的博客-CSDN博客
[2]MATLAB官网
本文内容来源于网络,仅供参考学习,如内容、图片有任何版权问题,请联系处理,24小时内删除。