MATLAB|不给糖果就捣蛋
目录
扫一扫关注公众号
效果图
代码
绘制南瓜
绘制无脸男小鬼
其中绘制风车代码:
其中 EllipsePlotter类函数代码如下
属性 (properties)
方法 (methods)
扫一扫关注公众号

效果图

代码
绘制南瓜
clc;clear;close all;
[X,Y,Z]=sphere(200);
R=1+(-(1-mod(0:.1:20,2)).^2)/15;
surf(R.*X,R.*Y,(.8+(0-(1:-.01:-1)'.^4)*.2).*Z.*R,'FaceC',[ 1 0.4588 0.0941],'EdgeC','n')
axis('equal','off')
material([ .6, .9, .3, 2, .5 ])
lighting g
camlight
绘制无脸男小鬼
clc;clear;close all
fig=figure('Position',[476 224 672 642]);
ax=gca;
ax.Color='none';
ax.YLim=[0,15];
ax.XLim=[-3,14];
ax.Box='off';
ax.XColor='none';
ax.YColor='none';
axis equal;
hold on
pause(0.1)
[X, Y] = meshgrid(linspace(1, 0, 200));
image([-3, 14], [0, 15], Y*255);
colormap(gray)
pause(0.1)
ellipse = EllipsePlotter('a', 4, 'b', 6, 'x', 5.4, 'y', 6.2, ...
    'plotType', 'fill', 'fillColor', [.4,.4,.4], 'rotation', 0, ...
    'angleRange',[-25,205],'alpha',1,'lineWidth',6,'lineColor',[1,1,1]*0.9);
ellipse.plotEllipse();
d=[0 -0.3 -0.4 -0.6 -0.4 -0.3 0];
for i=1:7
    ellipse = EllipsePlotter('a',1.2, 'b', 3.3, 'x', 2.7+(i-1)*0.9, 'y', 5.5+d(i), ...
        'plotType', 'fill', 'fillColor',[.4,.4,.4], 'rotation', 0, ...
        'angleRange',[-200,20],'alpha',1,'lineWidth',6,'lineColor','none');
    ellipse.plotEllipse();
end
% 脸
pause(0.3)
FaceColor=[1.0 0.9627 0.9235];
ellipse = EllipsePlotter('a',3, 'b', 2.8, 'x',5.4, 'y',9, ...
    'plotType', 'fill', 'fillColor',FaceColor, 'rotation', 0, ...
    'angleRange',[0,360],'alpha',1,'lineWidth',2,'lineColor','none');
ellipse.plotEllipse();
% 眉毛、腮红、嘴
pause(0.3)
ellipse = EllipsePlotter('a',0.3, 'b',1, 'x',3.9, 'y',10.2, ...
    'plotType', 'fill', 'fillColor',[1.0 0.65 0.63], 'rotation', 15, ...
    'angleRange',[0,360],'alpha',1,'lineWidth',2,'lineColor','none');
ellipse.plotEllipse();

ellipse = EllipsePlotter('a',0.3, 'b',1, 'x',6.8, 'y',10.4, ...
    'plotType', 'fill', 'fillColor',[1.0 0.65 0.63], 'rotation', 160, ...
    'angleRange',[0,360],'alpha',1,'lineWidth',2,'lineColor','none');
ellipse.plotEllipse();
ellipse = EllipsePlotter('a',0.3, 'b',1, 'x',7, 'y',7.8, ...
    'plotType', 'fill', 'fillColor',[1.0 0.65 0.63], 'rotation', 0, ...
    'angleRange',[-200,20],'alpha',1,'lineWidth',2,'lineColor','none');
ellipse.plotEllipse();
ellipse = EllipsePlotter('a',0.3, 'b',1, 'x',4, 'y',7.6, ...
    'plotType', 'fill', 'fillColor',[1.0 0.65 0.63], 'rotation', -10, ...
    'angleRange',[-200,20],'alpha',1,'lineWidth',2,'lineColor','none');
ellipse.plotEllipse();
pause(0.3)
ellipse = EllipsePlotter('a',.84, 'b',1.1, 'x',3.9, 'y',8.9, ...
    'plotType', 'fill', 'fillColor',FaceColor, 'rotation', 0, ...
    'angleRange',[0,360],'alpha',1,'lineWidth',2,'lineColor','none');
ellipse.plotEllipse();
ellipse = EllipsePlotter('a',.84, 'b',1.2, 'x',7, 'y',9, ...
    'plotType', 'fill', 'fillColor',FaceColor, 'rotation', 0, ...
    'angleRange',[0,360],'alpha',1,'lineWidth',2,'lineColor','none');
ellipse.plotEllipse();
%嘴巴
pause(0.3)
ellipse = EllipsePlotter('a',.3, 'b',.5, 'x',5.3, 'y',7.9, ...
    'plotType', 'fill', 'fillColor',[0.9 0 0], 'rotation', 0, ...
    'angleRange',[-180,0],'alpha',1,'lineWidth',2,'lineColor','none');
ellipse.plotEllipse();

ellipse = EllipsePlotter('a',.5, 'b',.25, 'x',5.3, 'y',8, ...
    'plotType', 'fill', 'fillColor',FaceColor, 'rotation', 0, ...
    'angleRange',[-180,0],'alpha',1,'lineWidth',2,'lineColor','none');
ellipse.plotEllipse();
%眼袋
pause(0.2)
ellipse = EllipsePlotter('a',0.3, 'b',0.1, 'x',3.9, 'y',8.2, ...
    'plotType', 'fill', 'fillColor',[1 1 1]*0.8, 'rotation', 0, ...
    'angleRange',[0,360],'alpha',1,'lineWidth',2,'lineColor','none');
ellipse.plotEllipse();
ellipse = EllipsePlotter('a',0.3, 'b',0.11, 'x',7, 'y',8.2, ...
    'plotType', 'fill', 'fillColor',[1 1 1]*0.8, 'rotation', 0, ...
    'angleRange',[0,360],'alpha',1,'lineWidth',2,'lineColor','none');
ellipse.plotEllipse();
% 眼睛
pause(0.3)
ellipse = EllipsePlotter('a',0.7, 'b',0.6, 'x',3.9, 'y',9.1, ...
    'plotType', 'fill', 'fillColor',[0 0 0], 'rotation', 0, ...
    'angleRange',[0,360],'alpha',1,'lineWidth',2,'lineColor','none');
ellipse.plotEllipse();
ellipse = EllipsePlotter('a',0.7, 'b',0.6, 'x',7, 'y',9.1, ...
    'plotType', 'fill', 'fillColor',[0 0 0], 'rotation', 0, ...
    'angleRange',[0,360],'alpha',1,'lineWidth',2,'lineColor','none');
ellipse.plotEllipse();
% 心
pause(0.3)
t=0:0.025:2*pi;
x=(16*sin(t).^3)/10+5.5;
y=(13*cos(t)-5*cos(2*t)-2*cos(3*t)-cos(4*t))/10+4.8;
fill(x,y,'r','edgecolor','r');
%风车
pause(0.3)
hold on
plot([0 0.2],[9.5 7],'LineWidth',3,'Color',[0,0,1,0.5])
 colors = {'r', 'g', 'b', 'y';'c', 'm', 'g','c'};
L = 0.8;
center = [0,9.5]; % 定义风车的圆心
T=[0 pi/3];
for j = 1:4
    for i=1:2
        theta1 = (j-1) * pi/2+T(i);
        theta2 = theta1 + pi/2;
        P0 = center;
        P1 = center + L * [cos(theta1), sin(theta1)];
        P2 = center + L * [cos(theta2), sin(theta2)];
        Psharp = (P1 + P2) / 2;
        fill([P0(1), P1(1), Psharp(1)], [P0(2), P1(2), Psharp(2)], colors{i,j},'EdgeColor','none','FaceAlpha',0.8);
    end
end
%手
pause(0.3)
ellipse = EllipsePlotter('a',3, 'b',0.8, 'x',8.5, 'y',6, ...
    'plotType', 'fill', 'fillColor',[.4 .4 .4], 'rotation', -30, ...
    'angleRange',[100,250],'alpha',1,'lineWidth',2,'lineColor',[1,1,1]*0.6);
ellipse.plotEllipse();
ellipse = EllipsePlotter('a',3, 'b',0.8, 'x',8.7, 'y',6.1, ...
    'plotType', 'fill', 'fillColor',[.4 .4 .4], 'rotation', -30, ...
    'angleRange',[100,250],'alpha',1,'lineWidth',2,'lineColor','none');
ellipse.plotEllipse();
pause(0.3)
ellipse = EllipsePlotter('a',3, 'b',0.8, 'x',2.6, 'y',6, ...
    'plotType', 'fill', 'fillColor',[.4 .4 .4], 'rotation',20, ...
    'angleRange',[100,270],'alpha',1,'lineWidth',2,'lineColor',[1,1,1]*0.6);
ellipse.plotEllipse();
ellipse = EllipsePlotter('a',3, 'b',0.8, 'x',2.7, 'y',5.95, ...
    'plotType', 'fill', 'fillColor',[.4 .4 .4], 'rotation',20, ...
    'angleRange',[100,270],'alpha',1,'lineWidth',2,'lineColor','none');
ellipse.plotEllipse();
pause(0.3)
tex=sprintf('不给糖果\n  就捣蛋');
text(8,13,tex,'FontSize',30,'FontWeight','bold','Color','w');
其中绘制风车代码:
hold on
plot([0 0.2],[9.5 7],'LineWidth',3,'Color',[0,0,1,0.5])
 colors = {'r', 'g', 'b', 'y';'c', 'm', 'g','c'};
L = 0.8;
center = [0,9.5]; % 定义风车的圆心
T=[0 pi/3];
for j = 1:4
    for i=1:2
        theta1 = (j-1) * pi/2+T(i);
        theta2 = theta1 + pi/2;
        P0 = center;
        P1 = center + L * [cos(theta1), sin(theta1)];
        P2 = center + L * [cos(theta2), sin(theta2)];
        Psharp = (P1 + P2) / 2;
        fill([P0(1), P1(1), Psharp(1)], [P0(2), P1(2), Psharp(2)], colors{i,j},'EdgeColor','none','FaceAlpha',0.8);
    end
end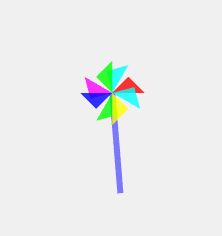
其中爱心代码:
t=0:0.025:2*pi;
x=(16*sin(t).^3)/10+5.5;
y=(13*cos(t)-5*cos(2*t)-2*cos(3*t)-cos(4*t))/10+4.8;
fill(x,y,'r','edgecolor','r');
其中 EllipsePlotter类函数代码如下
classdef EllipsePlotter
    properties
        a = 1;
        b = 1;
        x = 0;
        y = 0;
        angleRange = [0 2*pi];
        rotation = 0;
        lineColor = 'b';
        lineWidth = 1;
        plotType = 'plot';
        fillColor = 'r';
        alpha = 1;
    end
    methods
        function obj = EllipsePlotter(varargin)
            % Constructor
            if nargin > 0
                for i = 1:2:nargin
                    obj.(varargin{i}) = varargin{i+1};
                end
            end
            startRadian = obj.angleRange(1) * pi / 180;
            endRadian = obj.angleRange(2) * pi / 180;
            theta = startRadian:pi/100:endRadian;
        end
        function plotEllipse(obj)
            startRadian = obj.angleRange(1) * pi / 180;
            endRadian = obj.angleRange(2) * pi / 180;
            theta = startRadian:pi/100:endRadian;
            X = obj.a * cos(theta);
            Y = obj.b * sin(theta);
            % 旋转坐标
            rotationMatrix = [cosd(obj.rotation), -sind(obj.rotation); sind(obj.rotation), cosd(obj.rotation)];
            xyRotated = [X; Y]' * rotationMatrix;
            % 将旋转后的椭圆平移到指定的位置
            XY(:,1) = xyRotated(:,1) + obj.x;
            XY(:,2) = xyRotated(:,2) + obj.y;
            % 根据 plotType 来绘制椭圆
            if strcmp(obj.plotType, 'plot')
                plot(XY(:,1), XY(:,2), '-', 'Color', obj.lineColor, 'LineWidth', obj.lineWidth);
                hold on; axis equal
            elseif strcmp(obj.plotType, 'fill')
                fill(XY(:,1), XY(:,2), obj.fillColor, 'EdgeColor', obj.lineColor, 'FaceAlpha', obj.alpha, 'LineWidth', obj.lineWidth);
                hold on; axis equal
            else
                error('无效的 plotType 参数!');
            end
        end
    end
end
属性 (properties)
这些属性定义了椭圆的参数和绘图样式。
-
a, b: 椭圆的主轴和次轴的长度。
-
x, y: 椭圆的中心位置。
-
angleRange: 绘制椭圆的角度范围。
-
rotation: 椭圆的旋转角度。
-
lineColor: 椭圆边界的颜色。
-
lineWidth: 椭圆边界的线宽。
-
plotType: 绘图类型,可以是 'plot' 或 'fill'。
-
fillColor: 如果 plotType 是 'fill',则此属性定义填充颜色。
-
alpha: 填充的透明度。
方法 (methods)
这些方法定义了类的功能。
-
构造函数 (EllipsePlotter):
-
当创建这个类的对象时,它会被调用。
-
它接受一系列的名称-值对参数,允许在创建对象时设置属性。
-
它目前只计算了一个角度范围,但并没有使用这个范围做任何其他事情。
-
-
plotEllipse:
-
该方法根据对象的属性值绘制一个椭圆。
-
它首先计算了椭圆上的点的坐标。
-
然后根据 rotation 属性旋转这些点。
-
接着将旋转后的点平移到 x 和 y 属性指定的位置。
-
最后,根据 plotType 属性选择绘制方式:'plot' 会绘制椭圆的轮廓,而 'fill' 会填充椭圆。
-
这个类可以使用户轻松地创建和定制椭圆的绘图,而不必每次都重复相同的计算和绘图代码。例如,用户可以轻松地更改椭圆的大小、位置、颜色和旋转,并立即看到结果。