antv g2plot可视化图表在vue中的使用之三:图表皮肤主题theme配置
文章目录
- 简介
- 修改图表皮肤主题theme
- 自定义背景颜色
- 全局主题配置源码common.ts
- G2Plot 继承 G2 自定义主题机制
- 讨论
- 参考资料
简介
接前一篇文章,本文使用antv g2plot对vue中的图表皮肤主题theme进行配置。
修改图表皮肤主题theme
以折线图为例,原始代码为
//src/views/Line.vue
<template>
    <div id="linechart"></div>
</template>
<script>
import { Line } from '@antv/g2plot'
export default {
    mounted () {
    const data = [
      { year: '1991', value: 3 },
      { year: '1992', value: 4 },
      { year: '1993', value: 3.5 },
      { year: '1994', value: 5 },
      { year: '1995', value: 4.9 },
      { year: '1996', value: 6 },
      { year: '1997', value: 7 },
      { year: '1998', value: 9 },
      { year: '1999', value: 13 },
    ];

    const linePlot = new Line('linechart', {
      title: {
        visible: true,
        text: '折线图',
      },
      description: {
        visible: true,
        text: '用平滑的曲线代替折线。',
      },
      data,
      xField: 'year',
      yField: 'value',
    });

    linePlot.render();
  }
}
</script>
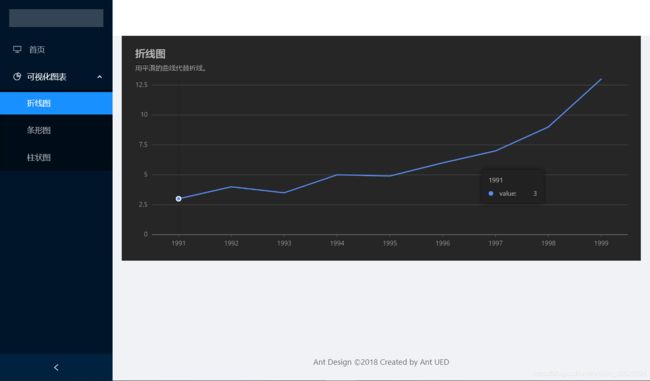
修改主题为暗黑风格,在参数中添加theme: 'dark’即可。参照文档https://github.com/antvis/G2Plot/blob/master/docs/common/theme.zh.md。主题支持 light、 dark 两种模式,当然也可以自己指定, 默认使用 light。
//src/views/Line.vue
<template>
    <div id="linechart"></div>
</template>
<script>
import { Line } from '@antv/g2plot'
export default {
    mounted () {
    const data = [
      { year: '1991', value: 3 },
      { year: '1992', value: 4 },
      { year: '1993', value: 3.5 },
      { year: '1994', value: 5 },
      { year: '1995', value: 4.9 },
      { year: '1996', value: 6 },
      { year: '1997', value: 7 },
      { year: '1998', value: 9 },
      { year: '1999', value: 13 },
    ];

    const linePlot = new Line('linechart', {
      title: {
        visible: true,
        text: '折线图',
      },
      description: {
        visible: true,
        text: '用平滑的曲线代替折线。',
      },
      data,
      theme: 'dark', //设置为暗黑主题。主题支持 light、 dark 两种模式,当然也可以自己指定, 默认使用 light。
      xField: 'year',
      yField: 'value',
    });

    linePlot.render();
  }
}
</script>
或者将渲染图表放在函数showLine里:
//src/views/Line.vue
<template>
    <div id="linechart"></div>
</template>
<script>
import { Line } from '@antv/g2plot'
export default {
    data(){
      return {
        linePlot: null,
        data: [{ year: '1991', value: 3 },
        { year: '1992', value: 4 },
        { year: '1993', value: 3.5 },
        { year: '1994', value: 5 },
        { year: '1995', value: 4.9 },
        { year: '1996', value: 6 },
        { year: '1997', value: 7 },
        { year: '1998', value: 9 },
        { year: '1999', value: 13 },
        ]
      }
    },
    mounted () {
      this.showLine();
    },
    methods: {
        showLine(){
          let data = this.data
          this.linePlot = new Line('linechart', {
            title: {
            visible: true,
            text: '折线图',
            },
            description: {
              visible: true,
              text: '用平滑的曲线代替折线。',
            },
            data,
            theme: 'dark',
            xField: 'year',
            yField: 'value',
          });

          this.linePlot.render();
        }
    }
}
</script>
暗黑风格效果如图:
自定义背景颜色
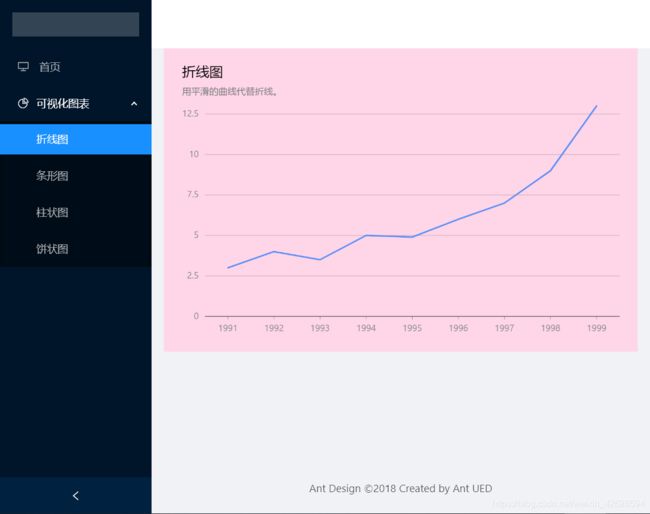
也可以对theme设置自己喜欢的颜色backgroundStyle:
//src/views/Line.vue
<template>
    <div id="linechart"></div>
</template>
<script>
import { Line } from '@antv/g2plot'
export default {
    mounted () {
    const data = [
      { year: '1991', value: 3 },
      { year: '1992', value: 4 },
      { year: '1993', value: 3.5 },
      { year: '1994', value: 5 },
      { year: '1995', value: 4.9 },
      { year: '1996', value: 6 },
      { year: '1997', value: 7 },
      { year: '1998', value: 9 },
      { year: '1999', value: 13 },
    ];

    const linePlot = new Line('linechart', {
      title: {
        visible: true,
        text: '折线图',
      },
      description: {
        visible: true,
        text: '用平滑的曲线代替折线。',
      },
      data,
      theme: {
        backgroundStyle: {
          fill: '#FFD6E7',
        },
      },
      xField: 'year',
      yField: 'value',
    });

    linePlot.render();
  }
}
</script>
效果如下:
全局主题配置源码common.ts
g2plot的github源码地址https://github.com/antvis/G2Plot/blob/master/src/adaptor/common.ts
//https://github.com/antvis/G2Plot/blob/master/src/adaptor/common.ts
/**
 * 设置全局主题配置
 * @param params
 */
export function theme<O extends Pick<Options, 'theme'>>(params: Params<O>): Params<O> {
  const { chart, options } = params;
  const { theme } = options;

  // 存在主题才设置主题
  if (theme) {
    chart.theme(theme);
  }
  return params;
}
在各个图表源码下引用了theme,如:
import { theme, scale, animation, annotation, tooltip } from '../../adaptor/common';
G2Plot 继承 G2 自定义主题机制
G2Plot 继承 G2 的自定义主题机制,见详细文档。
G2 提供了自定义主题机制以允许用户切换、定义图表主题。包括:
- 定义全新的主题结构
- 使用主题样式表,实现主题的快速定制
可参考https://github.com/antvis/G2Plot/tree/master/examples/general/theme
https://github.com/antvis/G2Plot/blob/master/examples/general/theme/API.zh.md
//G2自定义主题机制
import { registerTheme, Chart } from '@antv/g2';

// Step 1: 注册主题
registerTheme('newTheme', {
  defaultColor: 'red',
});

// Step 2: 使用
chart.theme('newTheme');
chart.render();
本文使用g2plot,参照github源码examples/general/theme/demo/register-theme.ts样例进行改造
//https://github.com/antvis/G2Plot/blob/master/examples/general/theme/demo/register-theme.ts
import { Pie, G2 } from '@antv/g2plot';

const { registerTheme } = G2;

registerTheme('custom-theme', {
  colors10: ['#FACDAA', '#F4A49E', '#EE7B91', '#E85285', '#BE408C', '#BE408C'],
  /** 20色板 */
  colors20: ['#FACDAA', '#F4A49E', '#EE7B91', '#E85285', '#BE408C', '#BE408C', '#942D93'],
});

const data = [
  { type: '分类一', value: 27 },
  { type: '分类二', value: 25 },
  { type: '分类三', value: 18 },
  { type: '分类四', value: 15 },
  { type: '分类五', value: 10 },
  { type: '其他', value: 5 },
];

const piePlot = new Pie('container', {
  appendPadding: 10,
  data,
  angleField: 'value',
  colorField: 'type',
  radius: 0.8,
  label: {},
  interactions: [{ type: 'element-active' }],
  theme: 'custom-theme',
});

piePlot.render();
改造如下,views文件夹下新建Pie.vue,并在路由文件index.js配置路由地址。
//src/views/Pie.vue改造前
<template>
    <div id="piechart"></div>
</template>
<script>
import { Pie } from '@antv/g2plot';

export default {
    mounted () {
    const data = [
      { type: '分类一', value: 27 },
      { type: '分类二', value: 25 },
      { type: '分类三', value: 18 },
      { type: '分类四', value: 15 },
      { type: '分类五', value: 10 },
      { type: '其他', value: 5 },
    ];
    const piePlot = new Pie('piechart', {
      appendPadding: 10,
      data,
      angleField: 'value',
      colorField: 'type',
      radius: 0.8,
      label: {},
      interactions: [{ type: 'element-active' }],
    });

    piePlot.render();

  }
}
</script>
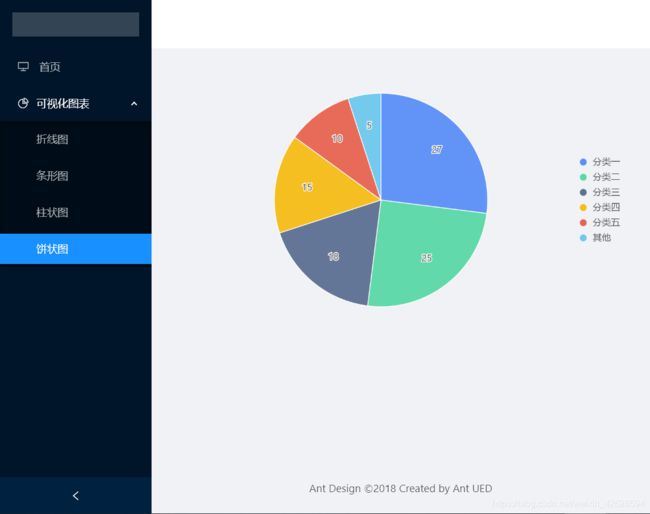
改造前效果:
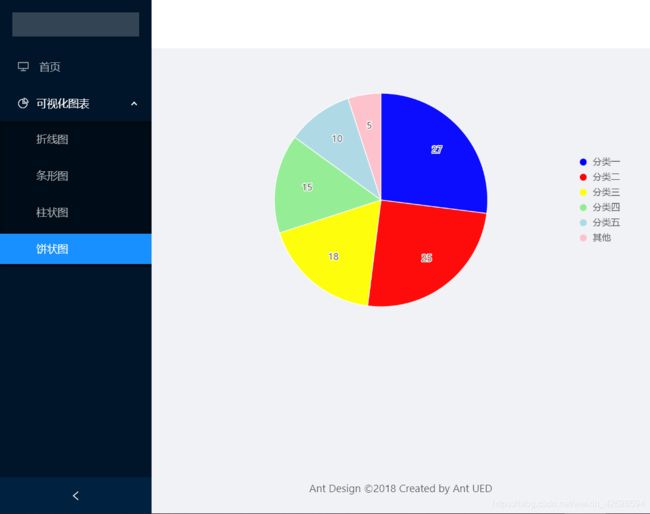
在上述代码中添加新的theme主题颜色配置:colors10: [‘blue’, ‘red’, ‘yellow’, ‘lightgreen’, ‘lightblue’, ‘pink’],
//src/views/Pie.vue改造后
<template>
    <div id="piechart"></div>
</template>
<script>
import { Pie } from '@antv/g2plot';

export default {
    mounted () {
    const data = [
      { type: '分类一', value: 27 },
      { type: '分类二', value: 25 },
      { type: '分类三', value: 18 },
      { type: '分类四', value: 15 },
      { type: '分类五', value: 10 },
      { type: '其他', value: 5 },
    ];
    const piePlot = new Pie('piechart', {
      appendPadding: 10,
      data,
      angleField: 'value',
      colorField: 'type',
      radius: 0.8,
      label: {},
      interactions: [{ type: 'element-active' }],
      theme: {
        colors10: ['blue', 'red', 'yellow', 'lightgreen', 'lightblue', 'pink'],
      },
    });

    piePlot.render();

  }
}
</script>
改造后效果:
讨论
关于dark主题的参数设置,在g2plot源码中未找到,如有知晓的同学还请在评论中留言告知。自定义机制中使用registerTheme未能成功,但是在g2plot-v2-beta中使用line.chart.theme(‘dark’);成功切换暗黑主题,详见
https://g2plot-v2-beta.antv.vision/zh/examples/line/basic#line插入
line.chart.theme('dark');
如本文对您有帮助,欢迎点赞或评论!!!
参考资料
https://www.yuque.com/antv/g2-docs/tutorial-theme (语雀AntV/G2 文档)
https://www.yuque.com/antv/g2plot/zok1sq (G2Plot 2.0 规划)
https://zhuanlan.zhihu.com/p/60812943 (知乎antv 修改主题 背景色)
https://github.com/antvis/G2Plot/issues/1226
https://github.com/antvis/G2Plot/issues/444
https://github.com/antvis/G2Plot/issues/1199
https://github.com/antvis/G2Plot/pull/1143/commits/9085d4fd6a7f92de3c1c83cb73314d590a24a067
https://g2.antv.vision/en/docs/manual/developer/registertheme
https://github.com/antvis/G2Plot/pull/1143
https://github.com/antvis/G2Plot/issues/1546
https://github.com/antvis/G2Plot/pull/1143/files/5c88e2c1ae414a9e20abe5c217c8bbeabbca11fb