Mathematica 如何绘制双纵坐标轴的图像?
来源:http://forum.simwe.com/thread-985179-1-1.html
提问:
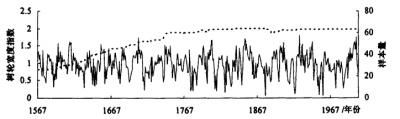
现在需要作出这样一张图,如附件
数据共用一个横轴,但纵轴不同。不能直接让某一组数据直接乘一个常数以画到一起。
麻烦大家看一下。本版有过关于双坐标轴的讨论,但好像跟这个情况都不太一样,故再此一问。
解答:
方法一:
Plot[{Sin[x], Cos[x]}, {x, -1, 1},

 Frame -> {{True, True}, {True, False}},

 FrameTicks -> {{Automatic, {{-0.5, 5}, {0, 10}, {0.5,

      15}}}, {Automatic, None}},

 FrameLabel -> {{"Left", "Right"}, {None, None}}]
方法二:
可以参考这个帖子:
https://groups.google.com/d/msg/comp.soft-sys.math.mathematica/CKE9Ghn43x8/F1_JnIbCYjsJ
Clear[TwoAxisDateListPlot];


TwoAxisDateListPlot[f_List, g_List, opts : OptionsPattern[]] :=

 Module[{p1, p2, fm, fM, gm, gM, old, new, newg},

  p1 = DateListPlot[f, Axes -> True, Frame -> False,

    PlotRange -> Automatic];

  p2 = DateListPlot[g, Axes -> True, Frame -> False,

    PlotRange -> Automatic];

  {fm, fM} = AbsoluteOptions[p1, PlotRange][[1, 2, 2]];

  {gm, gM} = AbsoluteOptions[p2, PlotRange][[1, 2, 2]];

  old = AbsoluteOptions[p2, Ticks][[1, 2, 2]];

  new = Flatten[{Rescale[First[#1], {gm, gM}, {fm, fM}], Rest[#1]},

      1] & /@ old;

  newg = {#[[1]], Rescale[#[[2]], {gm, gM}, {fm, fM}]} & /@ g;

  DateListPlot[{f, newg}, Axes -> False, Frame -> True,

   FrameTicks -> {Automatic, Automatic, None, new},

   PlotRange -> {fm, fM}, opts]]


Clear[TwoAxisReverseDateListPlot];


TwoAxisReverseDateListPlot[f_List, g_List, opts : OptionsPattern[]] :=

  Module[{p1, p2, fm, fM, gm, gM, old, new, newg},

  p1 = DateListPlot[f, Axes -> True, Frame -> False,

    PlotRange -> Automatic];

  p2 = DateListPlot[g, Axes -> True, Frame -> False,

    PlotRange -> Automatic];

  {fm, fM} = AbsoluteOptions[p1, PlotRange][[1, 2, 2]];

  {gm, gM} = AbsoluteOptions[p2, PlotRange][[1, 2, 2]];

  old = AbsoluteOptions[p2, Ticks][[1, 2, 2]];

  new = Flatten[{fM + fm - Rescale[First[#1], {gm, gM}, {fm, fM}],

       Rest[#1]}, 1] & /@ old;

  newg = {#[[1]], fM + fm - Rescale[#[[2]], {gm, gM}, {fm, fM}]} & /@

    g;

  DateListPlot[{f, newg}, Axes -> False, Frame -> True,

   FrameTicks -> {Automatic, Automatic, None, new},

   PlotRange -> {fm, fM}, opts]]


TwoAxisReverseDateListPlot[f_List, g_List, r_,

  opts : OptionsPattern[]] :=

 Module[{p1, p2, gg, pg2, m, M, fm, fM, gm, gM, ggm, ggM, old, new,

   newg}, p1 =

   DateListPlot[f, Axes -> True, Frame -> False,

    PlotRange -> Automatic];

  gg = g;

  gg[[All, 2]] /= 1 - r;

  p2 = DateListPlot[g, Axes -> True, Frame -> False,

    PlotRange -> Automatic];

  pg2 = DateListPlot[gg, Axes -> True, Frame -> False,

    PlotRange -> Automatic];

  {fm, fM} = AbsoluteOptions[p1, PlotRange][[1, 2, 2]];

  {m, M} = {fm, 1/r fM};

  {gm, gM} = AbsoluteOptions[p2, PlotRange][[1, 2, 2]];

  {ggm, ggM} = AbsoluteOptions[pg2, PlotRange][[1, 2, 2]];

  old = AbsoluteOptions[pg2, Ticks][[1, 2, 2]];

  new = Flatten[{(M + m - Rescale[First[#1], {ggm, ggM}, {m, M}]),

       Rest[#1]}, 1] & /@ old;

  newg = {#[[

       1]], (M + m - (1 - r) Rescale[#[[2]], {gm, gM}, {m, M}])} & /@

    g;

  DateListPlot[{f, newg}, Axes -> False, Frame -> True,

   FrameTicks -> {Automatic, new, None, All}, PlotRange -> {m, M},

   opts]]