nagios+redhat5.8+nrpe监控及测试
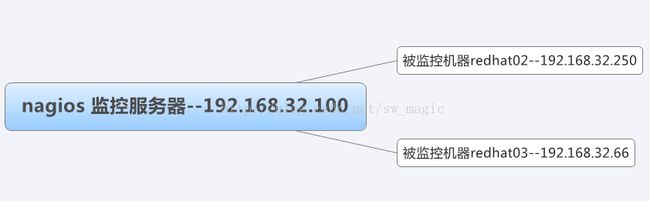
2014-02-24 今天完整的做了下nagios监控,感觉意义非常大也很好玩!以下是我做实验的架构.
1、nagios监控服务器的搭建及安装调试
1.1Nagios 安装
1.1.1安装前的准备
1. 安装软件包
- #yum install gd fontconfig-devel libjpeg-devel libpng-devel gd-devel perl-GD
- openssl-devel php mailx postfix cpp gcc gcc-c++ libstdc++ glib2-devel
- libtoul-ltdl-devel
- #groupadd -g 6000 nagios #创建用户组nagios 并指定ID为6000
- #groupadd -g 6001 nagcmd #创建用户组nagcmd 并指定ID为6001
- #useradd -u 6000 -g nagios -G nagcmd -d /home/nagios -c "Nagios Admin" nagios
-c:加上备注文字,备注文字保存在passwd的备注栏中。
-g:指定用户所属的群组。
-G:指定用户所属的附加群组。
-d:指定用户登入时的启始目录。
3.编译安装
- # tar xzfv nagios--4.0.5.tar.gz
- # cd nagios-4.0.5
- # ./configure --prefix=/usr/local/nagios --with-nagios-user=nagios \
- --with-nagios-group=nagios --with-command-user=nagios
- --with-command-group=nagcmd --enable-event-broker --enable-nanosleep
- --enable-embedded-perl --with-perlcache
- #make all
- #make install
- #make install-init
- #make install-commandmode
- #make install-webconf
- #make install-config
由于 Nagios 提供了 Web 监控界面,可通过 Web 界面的方式可以清晰地看到被监控的主机和资源的运行状态等,因此安装需要安装 Apache 服务。 同时配置 Web 监控界面是需要 PHP 模块的支持,这里均选用当前系统自带软件包即可,也可通过源码包编译安装。
(1)安装 Apache 和 php
#yum install httpd php*
在 Apache 配置文件件/etc/httpd/conf/httpd.conf 中找到
DirectoryIndex index.html index.html.var
将其修改为:
DirectoryIndex index.html index.html.var index.php
再在 Apache 配置文件下增加如下内容
AddType application/x-httpd-php .php
(2)以上两处主要用于增加 php 格式的支持。同时为了安全,需要经过授权才能访问 Nagios 的 Web 监控界面,所以需要在配置文件/etc/httpd/conf/http.conf 或 /etc/httpd/conf.d/nagios.conf 增加访问控制配置,若定义在 httpd.conf 文件中,将下面的语句加入到 httpd.conf 文件最后面即可.
Alias /nagios/cfi-bin "/usr/local/nagios/sbin"
Options Indexes FollowSymLinks
AllowOverride None
Order allow,deny
Allow from all
AuthName "Nagios Aceess"
AuthType Basic
AuthUserFile /usr/local/nagios/etc/htpasswd.users
Require valid-user
Alias /nagios "/usr/local/nagios/share"
Options None
AllowOverride None
Order allow,deny
Allow from all
AuthName "Nagios Aceess"
AuthType Basic
AuthUserFile /usr/local/nagios/etc/htpasswd.users
Require valid-user
(3)设置用户访问控制
- #htpasswd -c /usr/local/nagios/etc/htpasswd.users nagiosadmin
设置权限且重启 Apache
- #chwon nagios:nagcmd /usr/local/nagios/etc/htpasswd.users
- #usermod -a -G nagios:nagcmd apache
- #/etc/init.d/httpd restart
(4)安装 Postfix 邮件服务
Nagios 监控平台支持邮件报警功能,所以需要安装邮件服务。这里采用互联网比较主流的 MTA —Postfix. 也可根据自己的生产环境去定义, 如: Sendmail、Qmail 等。由于 Nagios 只用到了 Postfix 的邮件发送功能,所以这里不需要对 Postfix 邮件服务作过多配置,安装 Postfix 套件,启动服务并在下次服务器重启自动加载即可。具体如下命令:
- #yum install postifx
- #chkconfig postfix on; /etc/init.d/postfix restart
2.安装 Nagios 插件
Naigos 提供的各种监控功能基本上是通过插件来完成的,而 Nagios 的核心指提供了很少的功能,因此安装插件是非常有必要的。Nagios 官网提供了很多不同版块的插件应用,同时插件版本与 Nagios 版本也没有什么关联,如果支持汉化功能,则需要找到与之匹配的汉化软件包,否则会导致部分功能不能完成运行,这里保持默认英文,如下面的安装细节:
- # tar xzf nagios-plugins-2.2.tar.gz
- # cd nagios-plugins-2.2
- # ./configure --with-nagios-user=nagios --with-nagios-group=nagios \
- --with-command-user=nagios --with-command-group=nagcmd \
- --prefix=/usr/local/nagios
- # make all
- # make install
- # chmod 755 /usr/local/nagios
这样 Nagios 的插件就安装完成了,通过查看 Nagios 主程序目录,/usr/local/nagios/linexec 目录下可以看到很多的外部插件执行文件,如下图:

重启 Nagios: 服务Nagios 与 Apache 服务启动与设定

- #/etc/init.d/nagios restart
- #/etc/init.d/httpd restart
- #chkconfig httpd on; chkconfig naigos on
3 Nagios 配置
3.1 配置文件详解 这里为了方便以后的管理,在/usr/local/nagios/etc下创建目录monitor,并将object下的文件都拷贝
到此文件下。注意修改权限哦!
3.2 配置nagios文件
在monitor中创建hosts.cfg文件来定义主机和主机组
在monitor中创建services.cfg文件来定义服务
用默认的contacts.cfg文件来定义联系人和联系人组
用默认的commands.cfg文件来定义命令
用默认的timeperiods.cfg来定义监控时间段
用默认的templates.cfg文件作为模板资源引用文件
在monitor中创建services.cfg文件来定义服务
用默认的contacts.cfg文件来定义联系人和联系人组
用默认的commands.cfg文件来定义命令
用默认的timeperiods.cfg来定义监控时间段
用默认的templates.cfg文件作为模板资源引用文件
(1)
templates.cfg文件 模板文件
define contact{
name generic-contact #联系人名称,
service_notification_period 24x7 #当服务出现异常时,发送通知的时间段,这个时间段“7x24"在 timeperiods.cfg文件中定义
host_notification_period 24x7 #当主机出现异常时,发送通知的时间段,这个时间段“7x24"在 timeperiods.cfg文件中定义
service_notification_options w,u,c,r #这个定义的是“通知可以被发出的情况”。w即warn,表示警告状 态,u即unknown,表示不明状态,c即criticle,表示紧急状态,r 即recover,表示恢复状态。也就是在服务出现警告状态、未知状 态、紧急状态和重新恢复状态时都发送通知给使用者。
host_notification_options d,u,r #定义主机在什么状态下需要发送通知给使用者,d即down,表示宕机 状态,u即unreachable,表示不可到达状态,r即recovery,表示重新恢 复状态。
service_notification_commands notify-service-by-email #服务故障时,发送通知的方式,可以是邮件 和短信,这里发送的方式是邮件,其中“notify- service-by-email”在commands.cfg文件中定 义。
host_notification_commands notify-host-by-email #主机故障时,发送通知的方式,可以是邮件和短 信,这里发送的方式是邮件,其中“notify-host-by- email”在commands.cfg文件中定义。
register 0
}
define host{
name generic-host #主机名称,这里的主机名,并不是直接对应到真正机器的主机名,乃是对应到在 主机配置文件里所设定的主机名。
notifications_enabled 1
event_handler_enabled 1
flap_detection_enabled 1
failure_prediction_enabled 1
process_perf_data 1
retain_status_information 1
retain_nonstatus_information 1
notification_period 24x7 #指定“发送通知”的时间段,也就是可以在什么时候发送通知给使用者。
register 0
}
define host{
name linux-server #主机名称
use generic-host #use表示引用,也就是将主机generic-host的所有属性引用到linux-server中来,在 nagios配置中,很多情况下会用到引用。
check_period 24x7 #这里的check_period告诉nagios检查主机的时间段
check_interval 5 #nagios对主机的检查时间间隔,这里是5分钟。
retry_interval 1 #重试检查时间间隔,单位是分钟。
max_check_attempts 10 #nagios对主机的最大检查次数,也就是nagios在检查发现某主机异常时,并不马 上判断为异常状况,而是多试几次,因为有可能只是一时网络太拥挤,或是一些 其他原因,让主机受到了一点影响,这里的10就是最多试10次的意思。
check_command check-host-alive #指定检查主机状态的命令,其中“check-host-alive”在 commands.cfg文件中定义。
notification_period workhours #主机故障时,发送通知的时间范围,其中“workhours”在 timeperiods.cfg中进行了定义,下面会陆续讲到。
notification_interval 120 #在主机出现异常后,故障一直没有解决,nagios再次对使用者发 出通知的时间。单位是分钟。如果你觉得,所有的事件只需要一次 通知就够了,可以把这里的选项设为0
notification_options d,u,r #定义主机在什么状态下可以发送通知给使用者,d即down,表示宕机 状态,u即unreachable,表示不可到达状态,r即recovery,表示重新恢 复状态。
contact_groups admins #指定联系人组,这个“admins”在contacts.cfg文件中定义。
register 0
}
define service{
name generic-service #定义一个服务名称
active_checks_enabled 1
passive_checks_enabled 1
parallelize_check 1
obsess_over_service 1
check_freshness 0
notifications_enabled 1
event_handler_enabled 1
flap_detection_enabled 1
failure_prediction_enabled 1
process_perf_data 1
retain_status_information 1
retain_nonstatus_information 1
is_volatile 0
check_period 24x7 #这里的check_period告诉nagios检查服务的时间段。
max_check_attempts 3 #nagios对服务的最大检查次数。
normal_check_interval 10 #此选项是用来设置服务检查时间间隔,也就是说,nagios这一次检查 和下一次检查之间所隔的时间,这里是10分钟。
retry_check_interval 2 #重试检查时间间隔,单位是分钟。
contact_groups admins #指定联系人组,同上。
notification_options w,u,c,r #这个定义的是“通知可以被发出的情况”。w即warn,表示警告状态,u 即unknown,表示不明状态,c即criticle,表示紧急状态,r即recover, 表示恢复状态。也就是在服务出现警告状态、未知状态、紧急状态和重 新恢复后都发送通知给使用者。
notification_interval 60 #在服务出现异常后,故障一直没有解决,nagios再次对使用者发出通知的时 间。单位是分钟。如果你认为,所有的事件只需要一次通知就够了,可以把 这里的选项设为0。
notification_period 24x7 #指定“发送通知”的时间段,也就是可以在什么时候发送通知给使用者。
register 0
}
还有好多内容 今天写不完了 明天继续写