python进行SIFT和Harris的特征匹配处理实验结果对比及地理标记图像匹配
一、SiFT特征匹配
上一篇文章我们已经介绍了SIFT的特征提取原理及步骤,这篇我们来研究SIFT对的两张图片的特征点进行匹配。过程一般就是特征点提取,特征匹配。
为了计算图像的SIFT特征,我们用开源工具包VLFeat。用Python重新实现SIFT特征提取的全过程不会很高效,而且也超出了本书的范围。VLFeat可以在www.vlfeat.org上下载,它的二进制文件可以用于一些主要的平台。这个库是用C写的,不过我们可以利用它的命令行接口
1.1 SIFT特征匹配代码
from PIL import Image
from pylab import *
import sys
from PCV.localdescriptors import sift


if len(sys.argv) >= 3:
  im1f, im2f = sys.argv[1], sys.argv[2]
else:
#  im1f = '../data/sf_view1.jpg'
#  im2f = '../data/sf_view2.jpg'
  im1f = '尚大楼/尚大楼45.jpg'
  im2f = '尚大楼/尚大楼50.jpg'
#  im1f = '../data/climbing_1_small.jpg'
#  im2f = '../data/climbing_2_small.jpg'
im1 = array(Image.open(im1f))
im2 = array(Image.open(im2f))

sift.process_image(im1f, 'out_sift_1.txt')
l1, d1 = sift.read_features_from_file('out_sift_1.txt')
figure()
gray()
subplot(121)
sift.plot_features(im1, l1, circle=False)

sift.process_image(im2f, 'out_sift_2.txt')
l2, d2 = sift.read_features_from_file('out_sift_2.txt')
subplot(122)
sift.plot_features(im2, l2, circle=False)

#matches = sift.match(d1, d2)
matches = sift.match_twosided(d1, d2)
print (('{} matches').format(len(matches.nonzero()[0])))

figure()
gray()
sift.plot_matches(im1, im2, l1, l2, matches, show_below=True)
show()
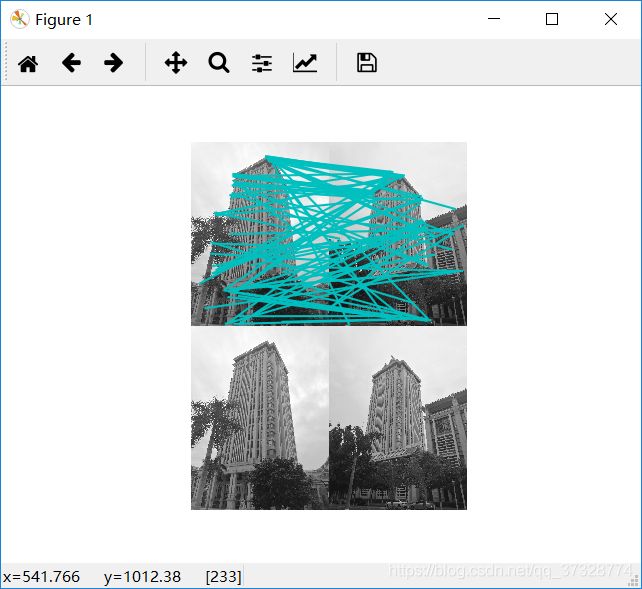
1.2实验结果

图一为SIFT的特征,图二为利用SIFT特征匹配结果。实验的分析我们在上一篇博客已经详细介绍了,这里就不再多说。
二、Harris特征匹配
Harris角点检测器可以给出图像中检测到兴趣点,但它并没有提供在图像间对兴趣点进行比较的方法,我们需要在每个角点添加描述子,以及对这些描述子进行比较,在图像中搜索有价值的特征点时,使用角点是一种不错的方法。 角点是很容易在图像中定位的局部特征, 并且大量存在于人造物体中(例如墙壁、 门、 窗户、 桌子等产生的角点)。 角点的价值在于它是两条边缘线的接合点, 是一种二维特征,可以被精确地定位(即使是子像素级精度)。 与此相反的是位于均匀区域或物体轮廓上的点以及在同一物体的不同图像上很难重复精确定位的点。 Harris特征检测是检测角点的经典方法。
2.1 Harris特征匹配代码
#*- coding: utf-8 -*-
from pylab import *
from PIL import Image

from PCV.localdescriptors import harris
from PCV.tools.imtools import imresize

"""
This is the Harris point matching example in Figure 2-2.
"""
im1 = array(Image.open("尚大楼/尚大楼45.jpg").convert("L"))
im2 = array(Image.open("尚大楼/尚大楼50.jpg").convert("L"))

#resize加快匹配速度
im1 = imresize(im1, (int(im1.shape[1]/2), int(im1.shape[0]/2)))
im2 = imresize(im2, (int(im2.shape[1]/2), int(im2.shape[0]/2)))

wid = 5
harrisim = harris.compute_harris_response(im1, 5)
filtered_coords1 = harris.get_harris_points(harrisim, wid+1)
d1 = harris.get_descriptors(im1, filtered_coords1, wid)

harrisim = harris.compute_harris_response(im2, 5)
filtered_coords2 = harris.get_harris_points(harrisim, wid+1)
d2 = harris.get_descriptors(im2, filtered_coords2, wid)

print ('starting matching')
matches = harris.match_twosided(d1, d2)

figure()
gray()
harris.plot_matches(im1, im2, filtered_coords1, filtered_coords2, matches)
show()
2.2实验结果
我们可以看到有的匹配点并不对,说明了Harris还不够满足我们对匹配点的要求。
三、SIFT和Harris的优缺点对比
Harris特征点匹配的精度低和效率不高,运算慢、抗噪能力差以及在实际应用中存在不必要角点簇,Harris特征点检测算法采用高斯滤波进行平滑,图像存在角点信息丢失与偏移的现象。
SIFT方法对于旋转、尺度缩放、亮度变化保持不变性,而且对视角变化、仿射变换、噪声也保持一定程度的稳定性,特征点的个数和有效点的比例没有要求。当特征点不是很多时,经优化的SIFT匹配算法甚至可以达到实时的要求。而且可以很方便的与其他形式的特征向量进行联合。特征点的个数和有效点的比例没有要求。当特征点不是很多时,经优化的SIFT匹配算法甚至可以达到实时的要求。而且可以很方便的与其他形式的特征向量进行联合,SIFT算法也有一些不足。方法通过对特征点构造128维的向量,然后对向量进行匹配,这样图像就得满足足够多的纹理,否则构造出的128维向量区别性就不是太大,容易造成误匹配,极限情况如指纹图像的匹配,星图识别等这类图像特征点周围根本没有什么纹理这时SIFT算法就完全失效了。
四、地理标记图像匹配
4.1代码
from pylab import *
from PIL import Image
from PCV.localdescriptors import sift
from PCV.tools import imtools
import pydot

""" This is the example graph illustration of matching images from Figure 2-10.
To download the images, see ch2_download_panoramio.py."""

#download_path = "panoimages"  # set this to the path where you downloaded the panoramio images
#path = "/FULLPATH/panoimages/"  # path to save thumbnails (pydot needs the full system path)

download_path = "D:\vscode\code\shangda"  # set this to the path where you downloaded the panoramio images
path = "D:\vscode\code"  # path to save thumbnails (pydot needs the full system path)

imlist = imtools.get_imlist(download_path)
nbr_images = len(imlist)

featlist = [imname[:-3] + 'sift' for imname in imlist]
for i, imname in enumerate(imlist):
    sift.process_image(imname, featlist[i])

matchscores = zeros((nbr_images, nbr_images))

for i in range(nbr_images):
    for j in range(i, nbr_images):  # only compute upper triangle
        print('comparing ', imlist[i], imlist[j])
        l1, d1 = sift.read_features_from_file(featlist[i])
        l2, d2 = sift.read_features_from_file(featlist[j])
        matches = sift.match_twosided(d1, d2)
        nbr_matches = sum(matches > 0)
        print('number of matches = ', nbr_matches)
        matchscores[i, j] = nbr_matches
print("The match scores is: \n", matchscores)
for i in range(nbr_images):
    for j in range(i + 1, nbr_images):  # no need to copy diagonal
        matchscores[j, i] = matchscores[i, j]

#可视化

threshold = 2  # min number of matches needed to create link

g = pydot.Dot(graph_type='graph')  # don't want the default directed graph

for i in range(nbr_images):
    for j in range(i + 1, nbr_images):
        if matchscores[i, j] > threshold:
            # first image in pair
            im = Image.open(imlist[i])
            im.thumbnail((100, 100))
            filename = path + str(i) + '.png'
            im.save(filename)  # need temporary files of the right size
            g.add_node(pydot.Node(str(i), fontcolor='transparent', shape='rectangle', image=filename))

            # second image in pair
            im = Image.open(imlist[j])
            im.thumbnail((100, 100))
            filename = path + str(j) + '.png'
            im.save(filename)  # need temporary files of the right size
            g.add_node(pydot.Node(str(j), fontcolor='transparent', shape='rectangle', image=filename))
            g.add_edge(pydot.Edge(str(i), str(j)))
g.write_png('jmu.png')
图集

实验结果

面这个例子只是一个利用局部描述子进行匹配的很简单的例子。