使用pyqtgraph模块进行PyQt绘图(1)
使用pyqtgraph模块进行PyQt绘图(1)
- pyqtgraph模块简介
- 测试环境
- 模块简介
- pyqtgraph的核心特点
- PyQtGraph示例
- 与其他绘图库相比较
- 鼠标交互方式
- 如何使用pyqtgraph
pyqtgraph模块简介
测试环境
numpy == 1.16.3
PyQt5 == 5.11.3
pyqtgraph == 0.10.0
模块文档和API参考:http://www.pyqtgraph.org/documentation/
模块简介
pyqtgraph是Python平台上一种功能强大的2D/3D绘图库,相对于matplotlib库,由于其在内部实现方式上,使用了高速计算的numpy信号处理库以及Qt的GraphicsView框架,因此它在大数据量的处理及快速显示方面有着天然的优势,非常适合于需要快速绘图更新、视频或实时交互性的操作场合,在数学、科学和工程领域都有着广泛的应用。
https://baijiahao.baidu.com/s?id=1613655816059670784&wfr=spider&for=pc)
pyqtgraph的主要目的:
1)提供快速、可交互的绘图,用于显示数据(图表、视频等等)
2)提供有助于快速程序开发的工具(例如,像在Qt Designer中使用的 property trees
pyqtgraph 重度使用 Qt GUI平台(通过PyQt 或者 PySide)和 numpy,前者用于高性能绘图,后者用于大体量数据处理。
pyqtgraph使用Qt的GraphicsView框架,这是一个高性能的框架。
Linux,Windows和OSX平台都可以使用。
pyqtgraph的核心特点
- 基础绘图:图片,折线图,散点图
- 足够快的实时刷新图(视频数据或图片数据)
- 交互性的缩放平移,平均,FFT,SVG/PNG格式图片导出
- 用于标记或者选择绘图区域的小工具
- 用于标记或选择干性图的图形区域,并且自动分割多维图片数据的小工具
- 创建自定义的感兴趣的图片区域的框架
- 替代/补充 Qt的停靠系统,允许更复杂的停靠布置
- 用于动态接口的快速原型设计ParameterTree(参数树)小工具(与Qt Designer以及其他应用程序的property trees类似)
PyQtGraph示例
PyQtGraph自带很多示例,打开方式:
    import pyqtgraph.examples
    pyqtgraph.examples.run()
运行以后会出现以下界面
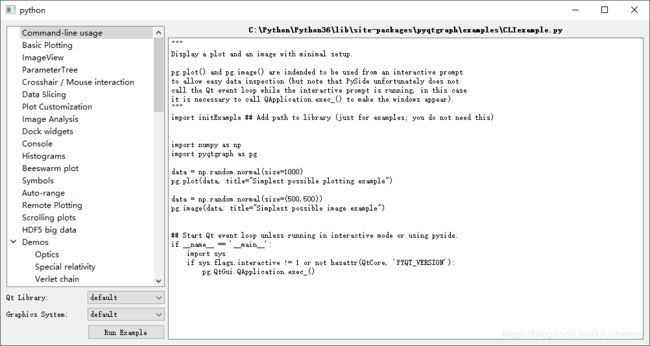
左侧为不同实例的列表,右侧是python源码
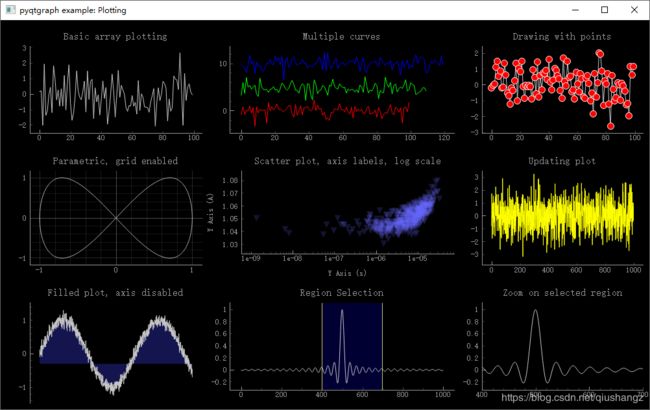
例如,在左侧列表中选择 Basic Plotting,单击左下角 Run Example按钮(或者直接双击列表中的条目),会出现下图所示的组合图表
与其他绘图库相比较
matplotlib
在绘图方面,pyqtgraph不如matplotlib成熟,但绘图速度远胜于matplotlib;
matplotlib主要目的是用来制作出版质量的图标,而pyatgraph的目的是制作数据获取和分析程序;
matplotlib更符合matlab程序员的习惯,pyqtpraph则更符合python和qt程序员的习惯。
matplotlib不包含但pyqtgraph包含的一些特性有,图像交互,容积成像,参数树,流程图等等
pyqwt5(没接触过也没啥兴趣,懒得翻译了)
About as fast as pyqwt5, but not quite as complete for plotting functionality. Image handling in pyqtgraph is much more complete (again, no ROI widgets in qwt). Also, pyqtgraph is written in pure python, so it is more portable than pyqwt, which often lags behind pyqt in development (I originally used pyqwt, but decided it was too much trouble to rely on it as a dependency in my projects). Like matplotlib, pyqwt (to my knowledge) does not include many of pyqtgraph’s features such as image interaction, volumetric rendering, parameter trees, flowcharts, etc.
鼠标交互方式
2D图形
- 左键:选择或移动对象
- 右键拖拽:缩放,向上放大y轴,向下缩小y轴,向左缩小x轴,向右放大x轴
- 右键单击:显示操作菜单
- 中键(滚轮)拖拽:平移
- 滚轮滚动:同时缩放x和y轴
左键拖拽有两种效果:
1-平移
2-绘制一个方框,松开左键后,将方框内的图形元素放大至整个坐标轴区域
默认为第1种模式:
切换至第2种模式有两种方式:
第一是使用下面的命令
pyqtgraph.setConfigOption('leftButtonPan', False)
第二种是右键单击,选择Mouse Mode,切换至1 button模式
右键菜单
单击右键的菜单内容:
- 使能或禁用数据变化时的自动缩放
- 多幅图坐标轴关联
- 使能或禁能单轴鼠标交互
- 显式设置显示区域值
3D图形(暂时用不上,不想翻了)
3D visualizations use the following mouse interaction:
Left button drag: Rotates the scene around a central point
Middle button drag: Pan the scene by moving the central “look-at” point within the x-y plane
Middle button drag + CTRL: Pan the scene by moving the central “look-at” point along the z axis
Wheel spin: zoom in/out
Wheel + CTRL: change field-of-view angle
And keyboard controls:
Arrow keys rotate around central point, just like dragging the left mouse button
如何使用pyqtgraph
关于使用方式的几种建议:
- 在交互环境中使用(例如ipython)
- 从应用中显示弹出式窗口
- 作为窗体嵌入PyQt程序中
我的目的是第三种,后面研究的环境是第三种