基于DeepChem的溶解度预测(图形卷积,神经网络)
DeepChem是一个机器学习库,用于对化合物的图结构进行卷积。
环境
- Python 3.6
- DeepChem 1.1.0
- TensorFlow 1.0.1
- RDKit 2020.03.2
基于DeepChem图卷积预测溶解度
导入库
import tensorflow as tf
import deepchem as dc
import numpy as np
载入数据
graph_featurizer = dc.feat.graph_features.ConvMolFeaturizer()
loader = dc.data.data_loader.CSVLoader( tasks = ['solubility'], smiles_field = "smiles", id_field = "name", featurizer = graph_featurizer )
dataset = loader.featurize( 'solubility.csv' )
Loading raw samples now. shard_size: 8192 About to start loading CSV from ./solubility.csv Loading shard 1 of size 8192. Featurizing sample 0 Featurizing sample 1000 TIMING: featurizing shard 0 took 1.425 s TIMING: dataset construction took 1.869 s Loading dataset from disk.
splitter = dc.splits.splitters.RandomSplitter()
trainset, testset = splitter.train_test_split( dataset )

hp = dc.molnet.preset_hyper_parameters
param = hp.hps[ 'graphconvreg' ]
print( param )

#
#n_atoms = 5
n_feat = 75
batch_size = 32

graph_model = dc.nn.SequentialGraph( n_feat )

graph_model.add( dc.nn.GraphConv( int( param[ 'n_filters' ]), n_feat, activation = 'relu' ) )
graph_model.add( dc.nn.BatchNormalization( epsilon = 1e-5, mode = 1 ) )
graph_model.add( dc.nn.GraphPool() )

## Gather Projection
#graph_model.add( dc.nn.Dense( int( param[ 'n_fully_connected_nodes' ] ),  int( param[ 'n_filters' ] ), activation = 'relu' ) )
graph_model.add( dc.nn.BatchNormalization( epsilon = 1e-5, mode = 1 ) )
graph_model.add( dc.nn.GraphGather( batch_size, activation = "linear" ) )
with tf.Session() as sess:
    model_graphconv = dc.models.MultitaskGraphRegressor( graph_model,
    1,
    n_feat,
    batch_size = batch_size,
    learning_rate = param[ 'learning_rate' ],
    optimizer_type = 'adam',
    beta1 = .9, beta2 = .999 )
    model_graphconv.fit( trainset, nb_epoch = 10 )
Starting epoch 9 On batch 0 On batch 50 On batch 100 On batch 150 On batch 200 On batch 250 On batch 300
test_scores = {}
train_scores = {}
regression_metric = dc.metrics.Metric( dc.metrics.mean_squared_error )
test_scores[ 'graphconvreg' ] = model_graphconv.evaluate( testset, [ regression_metric ]  )
train_scores[ 'graphconvreg' ] = model_graphconv.evaluate( trainset, [ regression_metric ]  )
computed_metrics: [0.66776533011426364] computed_metrics: [0.44895978015740012]
pred_train = model_graphconv.predict( trainset )
pred_test = model_graphconv.predict( testset )

y_train = np.array( trainset.y, dtype = np.float32 )
y_test = np.array( testset.y, dtype = np.float32 )
pred_train = np.array( pred_train, dtype=np.float32 )
pred_test = np.array( pred_test, dtype=np.float32)

import matplotlib.pyplot as plt

plt.figure()
plt.scatter( y_train, pred_train, label = 'Train', c = 'blue' )
plt.title( 'Neural Network Predictor' )
plt.xlabel( 'Measured Solubility' )
plt.ylabel( 'Predicted Solubility' )
plt.scatter( y_test, pred_test, c = 'lightgreen', label = 'Test', alpha = 0.8 )
plt.legend( loc = 4 )
plt.show()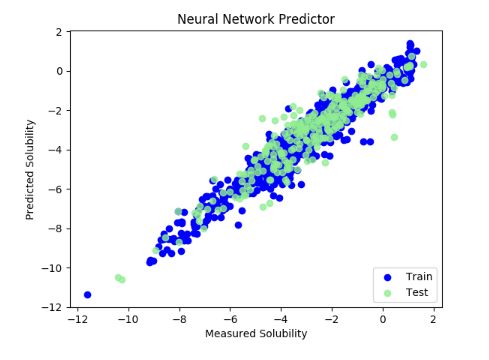
参考资料
http://www.ag.kagawa-u.ac.jp/charlesy/2017/07/27/deepchem%e3%81%ab%e3%82%88%e3%82%8b%e6%ba%b6%e8%a7%a3%e5%ba%a6%e4%ba%88%e6%b8%ac-graph-convolution-%e3%83%8b%e3%83%a5%e3%83%bc%e3%83%a9%e3%83%ab%e3%83%8d%e3%83%83%e3%83%88%e3%83%af%e3%83%bc%e3%82%af/