Debugging PHP using Xdebug and Notepad++
I am sure all of you have used ‘echo’ and ‘print_r’ to debug PHP.
We all know that this way debugging is hard and you need to remember to remove them from production server.
Well, thanks to xdebug you can now debug, and you don’t need expensive or blotted IDE for that, just plain and simple Notepad++ can do the job.
In this post we will setup xdebug and DBGp plugin with Notepad++.
Let’s start by installing xdebug.
- Download the latest release of xdebug for PHP version you are using.
- Copy xdebug dll file into php’s extension directory, in my case, as I use wamp, it is c:\wamp\php\ext .
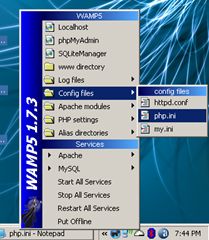
- Now we need to configure xdebug so that it get recognized by PHP, so open php.ini
- Add following at the end of your php.ini file
[xdebug]
zend_extension_ts="c:/wamp/php/ext/php_xdebug-2.0.3-5.2.5.dll"
xdebug.profiler_output_dir = "c:/wamp/tmp/xdebug"
xdebug.profiler_output_name = "cachegrind.out.%p"
xdebug.profiler_enable = 0
xdebug.profiler_append=0
xdebug.extended_info=1
xdebug.remote_enable=1
xdebug.remote_handler=dbgp
xdebug.remote_mode=req
xdebug.remote_host=127.0.0.1
xdebug.remote_port=9000
xdebug.idekey=xdebug
xdebug.remote_log="c:/wamp/tmp/xdebug/xdebug_remot.log"
xdebug.show_exception_trace=0
xdebug.show_local_vars=9
xdebug.show_mem_delta=0
xdebug.trace_format=0
- Just create a folder ‘xdebug’ in ‘c:\wamp\tmp’ folder.
- Finally restart Apache service .
With these steps you have, finished xdebug installation, it is configured for profiling application and remote debugging. Check documentation to know what all these configuration do, and tweak according to your preference.
We will now install DBGP plugin for Notepad++. Make sure you have latest version of Notepad++ is installed.
- Download the latest release of DBGp Plugin.
- Unzip and move dbgpPlugin.dll file to plugins folder of your notepad++ installation folder, in my case the path is “C:\Program Files\Notepad++\plugins”.
- Check out the readme.txt file, that is bundled with plugin, to make sure we don’t miss anything.
- Now open Notepad++, and you should see DBGp option in plugins menu.
Well we are now almost finished with setup, only ting remaining is to configure DBGP to listen to right port and we are done.
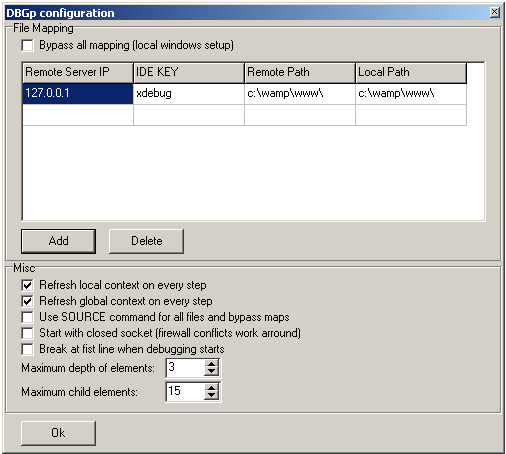
Goto “Plugins->DBGp->Config” to open the configuration screen of DBGp plugin.
Fill the details as shown in the image above. IDE KEY should be same to the one you specified in php.ini settings above. Click Ok and you are done.
To start debugging just add “?XDEBUG_SESSION_START=session_name” at end of you url. ‘session_name’ could be anything you want to keep.

