BSCAN 在糖尿病患者数据聚类分析中的应用
完整代码:
import numpy as np
import matplotlib.pyplot as plt
from sklearn.cluster import DBSCAN
from sklearn.preprocessing import StandardScaler
from sklearn.datasets import make_blobs
# 设置随机种子,确保结果可复现
np.random.seed(42)
# 1. 生成模拟的糖尿病患者数据
# 假设存在3种不同亚型的糖尿病患者
# 每个患者有3个特征:血糖水平、胰岛素水平、BMI
centers = [
[150, 8, 28], # 亚型1:高血糖、中等胰岛素、高BMI(胰岛素抵抗型)
[200, 4, 24], # 亚型2:非常高血糖、低胰岛素、正常BMI(胰岛素分泌不足型)
[120, 15, 32] # 亚型3:中等血糖、高胰岛素、超高BMI(代谢综合征型)
]
# 生成150个患者数据点,分为3个簇(亚型),并添加一些随机噪声
X, true_labels = make_blobs(n_samples=150, centers=centers, cluster_std=15, random_state=42)
# 添加一些异常点(模拟罕见病例)
outliers = np.array([
[300, 20, 18], # 异常高血糖、高胰岛素、低BMI(可能是特殊基因突变)
[80, 5, 25], # 低血糖、低胰岛素、正常BMI(可能是测量误差或其他疾病)
[180, 10, 19] # 中等血糖、中等胰岛素、低BMI
])
# 合并正常数据和异常点
X = np.vstack([X, outliers])
# 2. 数据预处理:标准化特征,确保各特征权重相等
scaler = StandardScaler()
X_scaled = scaler.fit_transform(X)
# 3. 使用DBSCAN进行聚类
# 参数说明:
# eps=0.5:邻域半径(默认单位是标准化后的距离)
# min_samples=5:形成核心点所需的最小样本数
dbscan = DBSCAN(eps=0.5, min_samples=5)
clusters = dbscan.fit_predict(X_scaled)
# 4. 可视化聚类结果
plt.figure(figsize=(12, 10))
# 绘制3D散点图,展示三个特征维度
ax = plt.subplot(111, projection='3d')
# 为每个聚类分配不同颜色,噪声点为灰色
unique_labels = set(clusters)
colors = [plt.cm.Spectral(each) for each in np.linspace(0, 1, len(unique_labels))]
for k, col in zip(unique_labels, colors):
if k == -1: # 噪声点(异常值)用灰色表示
col = [0, 0, 0, 1] # 黑色
class_mask = (clusters == k)
ax.scatter(X[class_mask, 0], X[class_mask, 1], X[class_mask, 2],
c=[col], marker='o', s=100, label=f'Cluster {k}')
ax.set_xlabel('血糖水平')
ax.set_ylabel('胰岛素水平')
ax.set_zlabel('BMI')
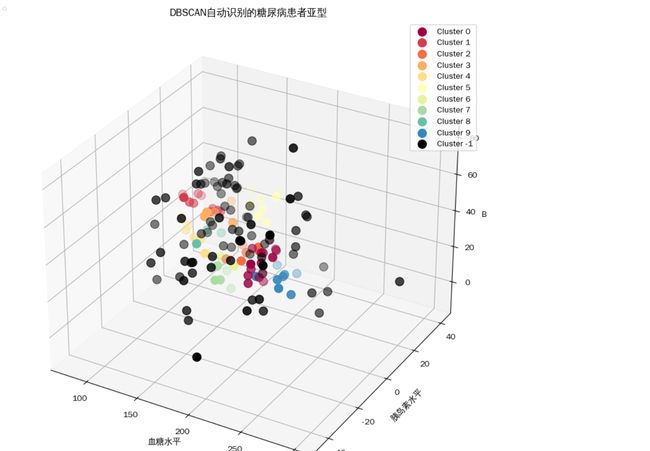
plt.title('DBSCAN自动识别的糖尿病患者亚型')
plt.legend()
plt.grid(True)
plt.show()
# 5. 输出聚类统计信息
cluster_stats = {}
for label in np.unique(clusters):
cluster_points = X[clusters == label]
if label == -1:
print(f"噪声点(异常患者): {len(cluster_points)}例")
print(f"特征均值: 血糖={np.mean(cluster_points[:,0]):.2f}, 胰岛素={np.mean(cluster_points[:,1]):.2f}, BMI={np.mean(cluster_points[:,2]):.2f}")
else:
print(f"\n亚型 {label+1}: {len(cluster_points)}例患者")
print(f"特征均值: 血糖={np.mean(cluster_points[:,0]):.2f}, 胰岛素={np.mean(cluster_points[:,1]):.2f}, BMI={np.mean(cluster_points[:,2]):.2f}")
这段代码实现了使用 DBSCAN 算法对糖尿病患者数据进行聚类分析,以识别不同的患者亚型和异常病例。以下是代码的详细解释:
1. 导入必要的库
| import numpy as np import matplotlib.pyplot as plt from sklearn.cluster import DBSCAN from sklearn.preprocessing import StandardScaler from sklearn.datasets import make_blobs |
- numpy:用于数值计算。
- matplotlib.pyplot:用于数据可视化。
- sklearn.cluster.DBSCAN:用于执行 DBSCAN 聚类算法。
- sklearn.preprocessing.StandardScaler:用于数据标准化。
- sklearn.datasets.make_blobs:用于生成模拟数据。
2. 设置随机种子
| np.random.seed(42) |
- 设置随机种子以确保结果的可重复性。
3. 生成模拟的糖尿病患者数据
| centers = [ [150, 8, 28], # 亚型1:高血糖、中等胰岛素、高BMI(胰岛素抵抗型) [200, 4, 24], # 亚型2:非常高血糖、低胰岛素、正常BMI(胰岛素分泌不足型) [120, 15, 32] # 亚型3:中等血糖、高胰岛素、超高BMI(代谢综合征型) ] X, true_labels = make_blobs(n_samples=150, centers=centers, cluster_std=15, random_state=42) |
- centers:定义了三种不同亚型糖尿病患者的中心特征值。
- make_blobs:生成 150 个患者数据点,分为 3 个簇(亚型),并添加一些随机噪声。
4. 添加异常点
| outliers = np.array([ [300, 20, 18], # 异常高血糖、高胰岛素、低BMI(可能是特殊基因突变) [80, 5, 25], # 低血糖、低胰岛素、正常BMI(可能是测量误差或其他疾病) [180, 10, 19] # 中等血糖、中等胰岛素、低BMI ]) X = np.vstack([X, outliers]) |
- outliers:定义了三个异常点,模拟罕见病例或测量误差。
- np.vstack:将正常数据和异常点合并。
5. 数据预处理
| scaler = StandardScaler() X_scaled = scaler.fit_transform(X) |
- StandardScaler:标准化特征,确保各特征权重相等。
- fit_transform:对数据进行标准化处理。
6. 使用 DBSCAN 进行聚类
| dbscan = DBSCAN(eps=0.5, min_samples=5) clusters = dbscan.fit_predict(X_scaled) |
- eps=0.5:邻域半径,定义点与点之间的距离阈值。
- min_samples=5:形成核心点所需的最小样本数。
- fit_predict:对数据进行聚类并返回聚类标签。
7. 可视化聚类结果
| plt.figure(figsize=(12, 10)) ax = plt.subplot(111, projection='3d') unique_labels = set(clusters) colors = [plt.cm.Spectral(each) for each in np.linspace(0, 1, len(unique_labels))] for k, col in zip(unique_labels, colors): if k == -1: col = [0, 0, 0, 1] # 黑色表示噪声点
class_mask = (clusters == k) ax.scatter(X[class_mask, 0], X[class_mask, 1], X[class_mask, 2], c=[col], marker='o', s=100, label=f'Cluster {k}') ax.set_xlabel('血糖水平') ax.set_ylabel('胰岛素水平') ax.set_zlabel('BMI') plt.title('DBSCAN自动识别的糖尿病患者亚型') plt.legend() plt.grid(True) plt.show() |
- 创建一个 3D 散点图来展示聚类结果。
- 不同颜色的点代表不同的聚类(患者亚型),黑色点代表噪声点(异常患者)。
8. 输出聚类统计信息
| cluster_stats = {} for label in np.unique(clusters): cluster_points = X[clusters == label] if label == -1: print(f"噪声点(异常患者): {len(cluster_points)}例") print(f"特征均值: 血糖={np.mean(cluster_points[:,0]):.2f}, 胰岛素={np.mean(cluster_points[:,1]):.2f}, BMI={np.mean(cluster_points[:,2]):.2f}") else: print(f"\n亚型 {label+1}: {len(cluster_points)}例患者") print(f"特征均值: 血糖={np.mean(cluster_points[:,0]):.2f}, 胰岛素={np.mean(cluster_points[:,1]):.2f}, BMI={np.mean(cluster_points[:,2]):.2f}") |
- 统计每个聚类的患者数量和特征均值。
- 噪声点(标签为 - 1)代表异常患者,其他标签代表不同的患者亚型。
核心功能
- 数据生成:模拟糖尿病患者数据,包括三种亚型和一些异常点。
- 数据预处理:标准化特征,确保各特征权重相等。
- 聚类分析:使用 DBSCAN 算法自动识别患者亚型和异常病例。
- 结果可视化:通过 3D 散点图直观展示聚类结果。
- 统计分析:输出每个聚类的患者数量和特征均值,帮助医生理解不同亚型的特征。
应用
- 发现新亚型:自动识别隐藏的患者亚型,帮助医生发现新的疾病类型。
- 异常检测:识别罕见病例或测量误差,提高诊断准确性。
- 个性化治疗:根据不同亚型制定个性化治疗方案,提高治疗效果。
通过这段代码,我们可以看到 DBSCAN 在医疗数据聚类中的应用,它能够自动识别数据中的模式和异常。