DS Wannabe之5-AM Project: DS 30day int prep day16
Q1.What is Statistics Learning?
Statistical learning: It is the framework for understanding data based on the statistics, which can be classified as the supervised or unsupervised. Supervised statistical learning involves building the statistical model for predicting, or estimating, an output based on one or more inputs, while in unsupervised statistical learning, there are inputs but no supervising output, but we can learn relationships and structure from such data.
Y=f(X)+ɛ,X=(X1,X2,...,Xp),
f : It is an unknown function & ɛ is random error (reducible & irreducible).
Prediction & Inference:
In the situations , where the set of inputs X are readily available, but the output Y is not known, we often treat f as the black box (not concerned with the exact form of “f”), as long as it yields the accurate predictions for Y. This is the prediction.
There are the situations where we are interested in understanding the way that Y is affected as X change. In this type of situation, we wish to estimate f, but our goal is not necessarily to make the predictions for Y. Here we are more interested in understanding the relationship between the X and Y. Now f cannot be treated as the black box, because we need to know it’s exact form. This is inference.
Parametric statistics: This statistical tests based on underlying the assumptions about data’s distribution. In other words, It is based on the parameters of the normal curve. Because parametric statistics are based on the normal curve, data must meet certain assumptions, or parametric statistics cannot be calculated. Before running any parametric statistics, you should always be sure to test the assumptions for the tests that you are planning to run.
f(X)=β0+β1X1+β2X2+...+βpXp
As by the name, nonparametric statistics are not based on parameters of the normal curve. Therefore, if our data violate the assumptions of a usual parametric and nonparametric statistics might better define the data, try running the nonparametric equivalent of the parametric test. We should also consider using nonparametric equivalent tests when we have limited sample sizes (e.g., n < 30). Though the nonparametric statistical tests have more flexibility than do parametric statistical tests, nonparametric tests are not as robust; therefore, most statisticians recommend that when appropriate, parametric statistics are preferred.
Prediction Accuracy and Model Interpretability:
Out of many methods that we use for the statistical learning, some are less flexible and more restrictive . When inference is the goal, then there are clear advantages of using the simple and relatively inflexible statistical learning methods. When we are only interested in the prediction, we use flexible models available.
Q2. What is ANOVA?
ANOVA: it stands for “ Analysis of Variance ” is an extremely important tool for analysis of data (both One Way and Two Way ANOVA is used). It is a statistical method to compare the population means of two or more groups by analyzing variance. The variance would differ only when the means are significantly different.
ANOVA test is the way to find out if survey or experiment results are significant. In other words, It helps us to figure out if we need to reject the null hypothesis or accept the alternate hypothesis. We are testing groups to see if there’s a difference between them. Examples of when we might want to test different groups:
-
The group of psychiatric patients are trying three different therapies: counseling, medication, and biofeedback. We want to see if one therapy is better than the others.
-
The manufacturer has two different processes to make light bulbs if they want to know which one is better.
-
Students from the different colleges take the same exam. We want to see if one college outperforms the other.
Types of ANOVA:
-
One-way ANOVA
-
Two-way ANOVA
One-way ANOVA is the hypothesis test in which only one categorical variable or the single factor is taken into consideration. With the help of F-distribution, it enables us to compare means of three or more samples. The Null hypothesis (H0) is the equity in all population means while an Alternative hypothesis is the difference in at least one mean.
There are two-ways ANOVA examines the effect of two independent factors on a dependent variable. It also studies the inter-relationship between independent variables influencing the values of the dependent variable, if any.
Q3. What is ANCOVA?
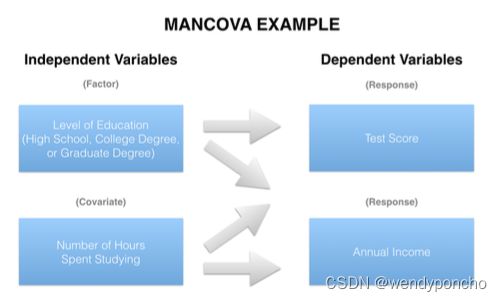
Analysis of Covariance (ANCOVA): It is the inclusion of the continuous variable in addition to the variables of interest ( the dependent and independent variable) as means for the control. Because the ANCOVA is the extension of the ANOVA, the researcher can still assess main effects and the interactions to answer their research hypotheses. The difference between ANCOVA and an ANOVA is that an ANCOVA model includes the “covariate” that is correlated with dependent variable and means on dependent variable are adjusted due to effects the covariate has on it. Covariates can also be used in many ANOVA based designs: such as between-subjects, within-subjects (repeated measures), mixed (between – and within – designs), etc. Thus, this technique answers the question
In simple terms, The difference between ANOVA and the ANCOVA is the letter "C", which stands for 'covariance'. Like ANOVA, "Analysis of Covariance" (ANCOVA) has the single continuous response variable. Unlike ANOVA, ANCOVA compares the response variable by both the factor and a continuous independent variable (example comparing test score by both 'level of education' and the 'number of hours spent in studying'). The terms for the continuous independent variable (IV) used in the ANCOVA is "covariate".

ANCOVA代表协方差分析(Analysis of Covariance),是一种统计技术,结合了方差分析(ANOVA)和回归分析的特点。ANCOVA主要用于研究一个或多个名义自变量(因子)对一个连续因变量的影响,同时控制一个或多个连续协变量(控制变量)的影响。这种技术可以提高实验设计的精确度,通过控制协变量可能带来的变异,使得我们更准确地评估自变量对因变量的影响。
ANCOVA的基本步骤如下:
-
选择协变量:选择与因变量相关但与实验处理(自变量)无关的连续变量。协变量的选择基于研究者对研究主题的理解和预先的假设。
-
检查前提条件:在进行ANCOVA之前,需要满足一些统计前提条件,包括协变量和因变量之间的线性关系、各组协变量的均值相等(同方差性)、残差的正态分布等。
-
进行协方差分析:在控制协变量的影响后,分析自变量对因变量的影响。这包括计算调整后的组均值和进行F检验来评估自变量的效应是否统计显著。
-
解释结果:如果自变量的效应显著,可以进一步探讨不同水平之间的差异。如果协变量的效应也显著,这表明调整协变量后,因变量的平均值有显著差异。
Q4. What is MANOVA?
MANOVA (multivariate analysis of variance): It is a type of multivariate analysis used to analyze data that involves more than one dependent variable at a time. MANOVA allows us to test hypotheses regarding the effect of one or more independent variables on two or more dependent variables.
The obvious difference between ANOVA and the "Multivariate Analysis of Variance" (MANOVA) is the “M”, which stands for multivariate. In basic terms, MANOVA is an ANOVA with two or more continuous response variables. Like ANOVA, MANOVA has both the one-way flavor and a two- way flavor. The number of factor variables involved distinguish the one-way MANOVA from a two- way MANOVA.
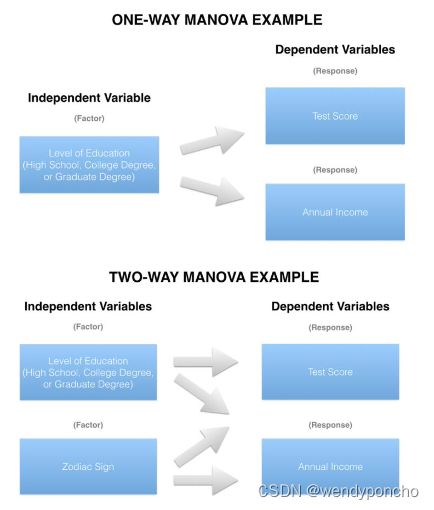
When comparing the two or more continuous response variables by the single factor, a one-way MANOVA is appropriate (e.g. comparing ‘test score’ and ‘annual income’ together by ‘level of education’). The two-way MANOVA also entails two or more continuous response variables, but compares them by at least two factors (e.g. comparing ‘test score’ and ‘annual income’ together by both ‘level of education’ and ‘zodiac sign’).
Q5. What is MANCOVA?
Multivariate Analysis of Covariance (MANCOVA) is an advanced statistical technique that expands upon the principles of ANCOVA (Analysis of Covariance) by accommodating multiple dependent variables. Similar to ANCOVA, which is used to control for the effects of one or more covariates while assessing the impact of an independent variable on a single dependent variable, MANCOVA controls for covariates but considers multiple continuous dependent variables simultaneously.
In MANCOVA, the primary objective is to evaluate how different groups (categorized by one or more independent variables) differ across several outcome variables, accounting for the variance attributed to one or more covariate(s). By including covariates, MANCOVA aims to reduce error variance and more accurately isolate the relationship between the independent variables and the dependent variables, enhancing the robustness of the findings.
Key points about MANCOVA include:
-
Multiple Dependent Variables: Unlike ANCOVA, which deals with a single continuous dependent variable, MANCOVA involves multiple continuous dependent variables. This allows for a more comprehensive analysis of complex datasets where multiple outcomes are of interest.
-
Control for Covariates: MANCOVA adjusts for the effects of covariates, which are continuous variables that are not of primary interest but could influence the dependent variables. By controlling for these, MANCOVA helps in isolating the effect of the main independent variables on the dependent outcomes.
-
Statistical Differences Assessment: The technique assesses for statistical differences across groups defined by independent variables, considering multiple outcomes simultaneously, which provides a more nuanced understanding of how these groups differ.
-
Error Reduction: By including covariates, MANCOVA aims to reduce the error terms, leading to more precise estimates of the effects of the independent variables on the dependent variables.
-
Extension of MANOVA: MANCOVA is essentially MANOVA with the addition of covariates. While MANOVA assesses the differences in multiple dependent variables across groups, MANCOVA adds another layer by controlling for one or more covariates, thus refining the analysis.
-
Covariates Effect Elimination: One of the goals of MANCOVA is to eliminate the effect of covariates on the relationship between the independent grouping variables and the dependent variables, providing a clearer picture of the direct effects of the independent variables.
anova to anocova, manova, mancova 四个变化
从ANOVA(单因素方差分析)到ANCOVA(协方差分析),再到MANOVA(多变量方差分析)和MANCOVA(多变量协方差分析),每个步骤都代表了统计分析方法的一个扩展,以适应更复杂的数据结构和研究设计。下表总结了这四种方法之间的主要变化:
| 统计方法 | 描述 | 主要特点 |
|---|---|---|
| ANOVA | 用于检验一个或多个名义自变量(因子)对一个连续因变量的影响是否存在统计显著差异。 | - 单一连续因变量 - 一个或多个名义自变量 - 不考虑协变量 |
| ANCOVA | 在ANOVA的基础上增加了协变量的控制,用于在分析自变量对因变量的影响时,控制一个或多个连续协变量的影响。 | - 单一连续因变量 - 一个或多个名义自变量 - 控制一个或多个连续协变量 |
| MANOVA | 扩展了ANOVA,允许同时考察多个连续因变量,以评估一个或多个名义自变量对这些因变量的整体影响。 | - 多个连续因变量 - 一个或多个名义自变量 - 不考虑协变量 |
| MANCOVA | 在MANOVA的基础上增加了协变量的控制,用于同时控制一个或多个连续协变量对多个连续因变量的影响。 | - 多个连续因变量 - 一个或多个名义自变量 - 控制一个或多个连续协变量 |
这个变化序列展示了从分析单一因变量到多个因变量的统计方法的演进,同时也从不控制任何外部变量到控制协变量以提高分析精度的过程。每个方法的选择取决于研究设计的复杂性、研究问题的性质以及数据的结构。
Q6. Explain the differences between KNN classifier and KNN regression methods.
They are quite similar. Given a value for KK and a prediction point x0x0, KNN regression first identifies theKKtraining observations that are closes tox0x0, represented byN0. It then estimates f(x0) using the average of all the training responses in N0. In other words,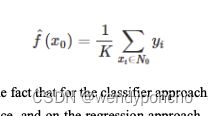
So the main difference is the fact that for the classifier approach, the algorithm assumes the outcome as the class of more presence, and on the regression approach, the response is the average value of the nearest neighbors.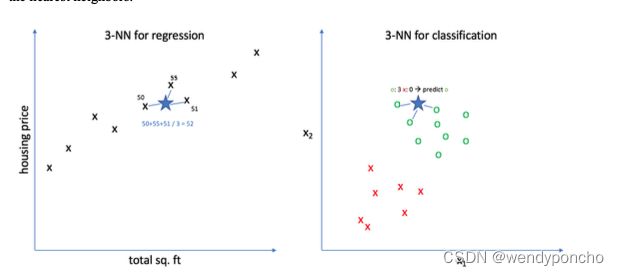
Here's a comparison of KNN Classifier and KNN Regression methods presented in a table form:
| Aspect | KNN Classifier | KNN Regression |
|---|---|---|
| Problem Type | Used for classification tasks | Used for regression tasks |
| Output | Class label (e.g., '0' or '1' in binary classification) | Continuous value (e.g., price of a house) |
| Decision Rule | Majority vote among the 'k' nearest neighbors | Average (or median) of the 'k' nearest neighbors' values |
| Distance Metric | Used to identify the most similar or frequently occurring class among neighbors | Used to estimate a continuous value based on proximity and values of neighbors |
| Sensitivity to 'k' | Small changes in 'k' can change the majority class among the neighbors, altering the class label for a new instance | Changes in 'k' lead to variations in the predicted value, as the average or median of neighbors' values changes |
| Evaluation Metrics | Accuracy, precision, recall, F1 score (categorical outcomes) | Mean Squared Error (MSE), Root Mean Squared Error (RMSE), Mean Absolute Error (MAE) (continuous outcomes) |
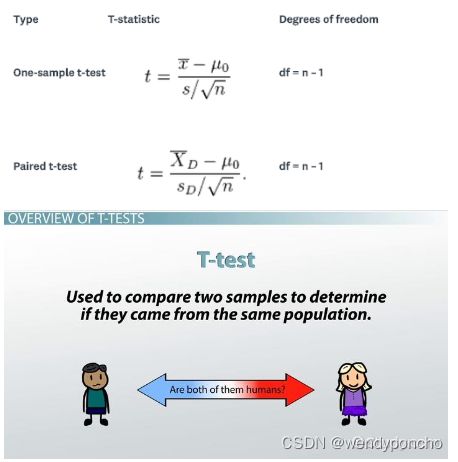
Q7. What is t-test?
To understand T-Test Distribution, Consider the situation, you want to compare the performance of two workers of your company by checking the average sales done by each of them, or to compare the performance of a worker by comparing the average sales done by him with the standard value. In such situations of daily life, t distribution is applicable.
A t-test is the type of inferential statistic used to determine if there is a significant difference between the means of two groups, which may be related in certain features. It is mostly used when the data sets, like the data set recorded as the outcome from flipping a coin 100 times, would follow a normal distribution and may have unknown variances. A t-test is used as a hypothesis testing tool, which allows testing of an assumption applicable to a population.
Understand t-test with Example: Let’s say you have a cold, and you try a naturopathic remedy. Your cold lasts a couple of days. The next time when you have a cold, you buy an over-the-counter pharmaceutical, and the cold lasts a week. You survey your friends, and they all tell you that their colds were of a shorter duration (an average of 3 days) when they took the homeopathic remedy. What you want to know is, are these results repeatable? A t-test can tell you by comparing the means of the two groups and letting you know the probability of those results happening by chance.
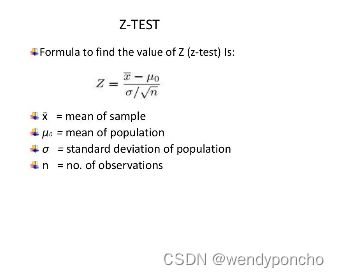
Q8. What is Z-test?
z-test: It is a statistical test used to determine whether the two population means are different when the variances are known, and the sample size is large. The test statistic is assumed to have the normal distribution, and nuisance parameters such as standard deviation should be known for an accurate z- test to be performed.
Another definition of Z-test: A Z-test is a type of hypothesis test. Hypothesis testing is just the way for you to figure out if results from a test are valid or repeatable. Example, if someone said they had found the new drug that cures cancer, you would want to be sure it was probably true. Hypothesis test will tell you if it’s probably true or probably not true. A Z test is used when your data is approximately normally distributed.
Z-Tests Working :
Tests that can be conducted as the z-tests include one-sample location test, a two-sample location test, a paired difference test, and a maximum likelihood estimate. Z-tests are related to t-tests, but t- tests are best performed when an experiment has the small sample size. Also, T-tests assumes the standard deviation is unknown, while z-tests assumes that it is known. If the standard deviation of the population is unknown, then the assumption of the sample variance equaling the population variance is made.
When we can run the Z-test :
Different types of tests are used in the statistics (i.e., f test, chi-square test, t-test). You would use a Z test if:
-
Your sample size is greater than 30. Otherwise, use a t-test.
-
Data points should be independent from each other. Some other words, one data point is not
related or doesn’t affect another data point.
-
Your data should be normally distributed. However, for large sample sizes (over 30), this doesn’t always matter.
-
Your data should be randomly selected from a population, where each item has an equal chance of being selected.
-
Sample sizes should be equal, if at all possible.
Q9. What is Chi-Square test?
Chi-square (χ2) statistic: It is a test that measures how expectations compare to actual observed data (or model results). The data used in calculating a chi-square statistic must be random, raw, mutually exclusive, drawn from independent variables, and drawn from a large enough sample. For example, the results of tossing a coin 100 times meet these criteria.
Chi-square test is intended to test how it is that an observed distribution is due to chance. It is also called the "goodness of fit" statistic because it measures how well the observed distribution of the data fits with the distribution that is expected if the variables are independent.

Chi-square test is designed to analyze the categorical data. That means that the data has been counted and divided into categories. It will not work with parametric or continuous data (such as height in inches). For example, if you want to test whether attending class influences how students perform on an exam, using test scores (from 0-100) as data would not be appropriate for a Chi-square test. However, arranging students into the categories "Pass" and "Fail" would. Additionally, the data in a Chi-square grid should not be in the form of percentages, or anything other than frequency (count) data.
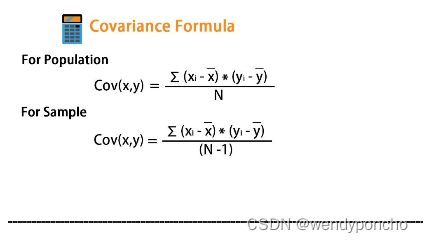
Q10. What is correlation and the covariance in the statistics?
The Covariance and Correlation are two mathematical concepts; these two approaches are widely used in the statistics. Both Correlation and the Covariance establish the relationship and also measures the dependency between the two random variables, the work is similar between these two, in the mathematical terms, they are different from each other.
Correlation: It is the statistical technique that can show whether and how strongly pairs of variables are related. For example, height and weight are related; taller people tend to be heavier than shorter people. The relationship isn't perfect. People of the same height vary in weight, and you can easily think of two people you know where the shorter one is heavier than the taller one. Nonetheless, the average weight of people 5'5'' is less than the average weight of people 5'6'', and their average weight is less than that of people 5'7'', etc. Correlation can tell you just how much of the variation in peoples' weights is related to their heights.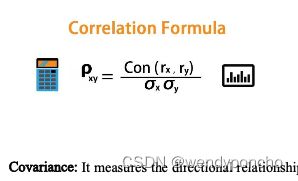
Covariance: It measures the directional relationship between the returns on two assets. The positive covariance means that asset returns move together while a negative covariance means they move inversely. Covariance is calculated by analyzing at-return surprises (standard deviations from the expected return) or by multiplying the correlation between the two variables by the standard deviation of each variable