flask-profiler:统计flask应用接口请求数和耗时情况
一、背景
我们基于Flask开发了一些测试工具和应用,有一天老板问我,说这个有多少人用啊?请求数目大概是怎样的?我支支吾吾一脸懵逼......
下来想了下,准备基于Python的装饰器和消息中间件(MQ)来做统计,即每个接口都加上这个装饰器,而这个装饰器的作用就是解析各个请求的相关信息,然后异步发送给一个消息中间件(MQ),最后写个消费者来处理这些消息并存储....
虽然思路有了,但是感觉实现成本还是挺大的,幸运的是找到了一个库:flask-profiler,实践了下,这个基本可以满足我们的需求。
二、flask-profiler的使用
Github地址:https://github.com/muatik/flask-profiler
使用 profiler测量在你的Flask 应用程序中定义的端点;并通过web界面提供细粒度的报告。它给出了下面这些问题的答案:
- 应用程序中的瓶颈在哪里?
- 应用程序中最慢的终结点?
- 哪些是最常被调用的终结点?
- 什么导致我的慢速端点? 在哪个上下文中,什么是 ARGS 和 kwargs?
- 特定请求花费了多少时间?
简而言之,如果你想对端点正在做什么和接收的请求信息,请尝试flask-profiler。
通过使用flask-profiler分析器接口,你可以监视所有端点的性能,并通过向下钻取过滤器来调查端点和接收的请求。
废话不多说,实践才是王道。
1.安装 flask_profiler
pip3 install flask_profiler2.Flask应用示例
说明:所有接口的请求记录是需要数据库存储的,这里我们使用的mongodb,你也可以使用SQLite、SQLAchemy等,详情可以查Github。
flask_profiler_demo.py
# -*- coding: UTF-8 -*-
"""
# rs
"""
import flask_profiler
from flask import Flask
from flask import jsonify
from flask import make_response

app = Flask(__name__)
app.config["DEBUG"] = True

# You need to declare necessary configuration to initialize
# flask-profiler as follows:
# flask-profiler的配置, 下面是以mongo作为存储,其它存储请参考官网
app.config["flask_profiler"] = {
    "enabled": app.config["DEBUG"],
    "storage": {
        "engine": "mongodb",
        "MONGO_URL": "mongodb://{user}:{password}@{address}",
        "DATABASE": "{database}",
        "COLLECTION": "{collection}"
    },
    "basicAuth": {
        "enabled": True,
        "username": "admin",
        "password": "admin"
    },
    "ignore": [
        "^/static/.*"
    ]
}


@app.route('/product/', methods=['GET'])
def getProduct(id):
    return "product id is " + str(id)


@app.route('/product/', methods=['PUT'])
def updateProduct(id):
    return "product {} is being updated".format(id)


@app.route('/products', methods=['GET'])
def listProducts():
    return "suppose I send you product list..."


@app.route('/static/something/', methods=['GET'])
def staticSomething():
    return "this should not be tracked..."


# In order to active flask-profiler, you have to pass flask
# app as an argument to flask-profiler.
# All the endpoints declared so far will be tracked by flask-profiler.
# 意思就是在这之前的都会被统计度量
flask_profiler.init_app(app)


# endpoint declarations after flask_profiler.init_app() will be
# hidden to flask_profiler.
# 不会会统计度量
@app.route('/doSomething', methods=['GET'])
def doSomething():
    return "flask-profiler will not measure this."


# But in case you want an endpoint to be measured by flask-profiler,
# you can specify this explicitly by using profile() decorator
# 如果手动加上装饰器: @flask_profiler.profile(), 也可以被统计到
@app.route('/doSomethingImportant', methods=['GET'])
@flask_profiler.profile()
def doSomethingImportant():
    return "flask-profiler will measure this request."


@app.route('/health', methods=["GET"])
@flask_profiler.profile()
def health():
    """
    # 健康检查
    :return:
    """
    result = {
        "code": "200",
        "message": "success",
        "data": "green"
    }
    return make_response(jsonify(result))


if __name__ == '__main__':
    app.run(host="127.0.0.1", port=5000)
3.测试验证
首先,启动服务:
python3 flask_profiler_demo.py


# 启动日志
 * Serving Flask app 'flask_demo' (lazy loading)
 * Environment: production
   WARNING: This is a development server. Do not use it in a production deployment.
   Use a production WSGI server instead.
 * Debug mode: on
 * Running on http://127.0.0.1:5000/ (Press CTRL+C to quit)
 * Restarting with watchdog (fsevents)
 * Debugger is active!
 * Debugger PIN: 721-605-328
访问可视化服务:http://127.0.0.1:5000/flask-profiler/
Ps:默认密码就是配置文件中的basicAuth设置的admin/admin
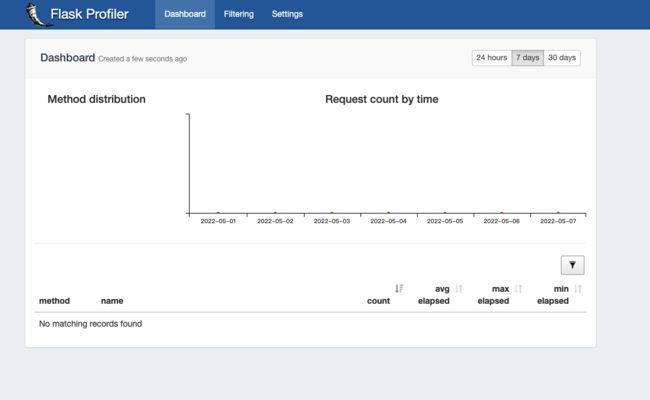
可以看到目前还没有数据,我们来发送几个请求给服务看看,如下:
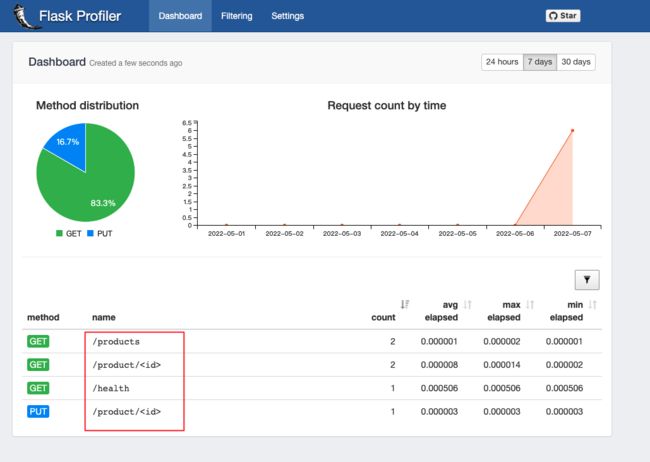
curl http://127.0.0.1:5000/health
curl http://127.0.0.1:5000/products
curl http://127.0.0.1:5000/product/123
curl -X PUT -d arg1=val1 http://127.0.0.1:5000/product/123
再看看统计的情况,可以发现刚才发的一些请求已经被统计到了,可以各个请求的次数、耗时情况。
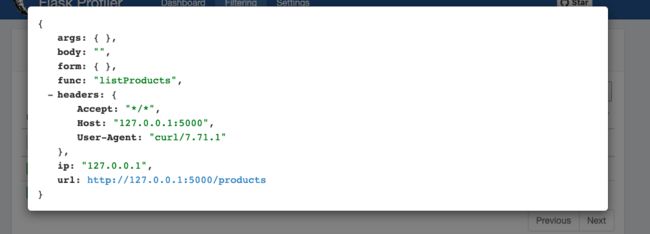
点击请求名称还可以看到具体的请求参数信息。
也支持简单的筛选操作。
除了在页面上面可视化查看之外,其实mongo数据库里面都存储了对应的数据,还可以通过这个接口查看所有的请求信息:http://127.0.0.1:5000/flask-profiler/api/measurements/?sort=elapsed,desc

4、问题记录
1、dashboard没有数据显示
有时候按照上面的配置设置了后,发现dashboard并没有展示数据,原因可能是没有设置app.config["DEBUG"] = True,或者说位置不对,我发现貌似把32行的内容放到31行前面去就不行。
