data science 相关问题(part 1)
1.There are two main methods for feature selection, i.e, filter, and wrapper methods.
- Filter methods measure the relevance of features by their correlation with dependent variable while wrapper methods measure the usefulness of a subset of feature by actually training a model on it.
Filter Methods
This involves:
- Linear discrimination analysis
- ANOVA
- Chi-Square
The best analogy for selecting features is "bad data in, bad answer out." When we're limiting or selecting the features, it's all about cleaning up the data coming in.
Wrapper Methods
This involves:
- Forward Selection: We test one feature at a time and keep adding them until we get a good fit
- Backward Selection: We test all the features and start removing them to see what works better
- Recursive Feature Elimination: Recursively looks through all the different features and how they pair together
Wrapper methods are very labor-intensive, and high-end computers are needed if a lot of data analysis is performed with the wrapper method.
2. You are given a data set consisting of variables with more than 30 percent missing values. How will you deal with them?
The following are ways to handle missing data values:
If the data set is large, we can just simply remove the rows with missing data values. It is the quickest way; we use the rest of the data to predict the values.
For smaller data sets, we can substitute missing values with the mean or average of the rest of the data using the pandas' data frame in python. There are different ways to do so, such as df.mean(), df.fillna(mean).
3. How should you maintain a deployed model?
The steps to maintain a deployed model are:
Monitor
Constant monitoring of all models is needed to determine their performance accuracy. When you change something, you want to figure out how your changes are going to affect things. This needs to be monitored to ensure it's doing what it's supposed to do.
Evaluate
Evaluation metrics of the current model are calculated to determine if a new algorithm is needed.
Compare
The new models are compared to each other to determine which model performs the best.
Rebuild
The best-performing model is re-built on the current state of data.
4.

Precision = (True positive) / (True Positive + False Positive)
= 262 / 277
= 0.94
Recall Rate = (True Positive) / (True Positive + False Negative)
= 262 / 288
= 0.90
实际上非常简单, 精确率是针对我们 预测结果而言的,它表示的是预测为正的样本中有多少是真正的 正样本。那么预测为正就有两种可能了,一种就是把正类预测为正类(TP),另一种就是把负类预测为正类(FP),也就是
P=TPTP+FPP = \frac{TP}{TP+FP}
而 召回率是针对我们原来的 样本而言的,它表示的是样本中的正例有多少被预测正确了。那也有两种可能,一种是把原来的正类预测成正类(TP),另一种就是把原来的正类预测为负类(FN)。
R=TPTP+FNR = \frac{TP}{TP+FN}
其实就是分母不同,一个分母是预测为正的样本数,另一个是原来样本中所有的正样本数。
作者:Charles Xiao
链接:https://www.zhihu.com/question/19645541/answer/91694636
来源:知乎
著作权归作者所有。商业转载请联系作者获得授权,非商业转载请注明出处。
5. Write a basic SQL query that lists all orders with customer information.
Usually, we have order tables and customer tables that contain the following columns:
- Order Table
- Orderid
- customerId
- OrderNumber
- TotalAmount
- Customer Table
- Id
- FirstName
- LastName
- City
- Country
- The SQL query is:
- SELECT OrderNumber, TotalAmount, FirstName, LastName, City, Country
- FROM Order
- JOIN Customer
- ON Order.CustomerId = Customer.Id
6. You are given a dataset on cancer detection. You have built a classification model and achieved an accuracy of 96 percent. Why shouldn't you be happy with your model performance? What can you do about it?
Cancer detection results in imbalanced data. In an imbalanced dataset, accuracy should not be based as a measure of performance. It is important to focus on the remaining four percent, which represents the patients who were wrongly diagnosed. Early diagnosis is crucial when it comes to cancer detection, and can greatly improve a patient's prognosis.
Hence, to evaluate model performance, we should use Sensitivity (True Positive Rate), Specificity (True Negative Rate), F measure to determine the class wise performance of the classifier.
应用场景:在precision和recall两者要求同样高的情况下,可以用F1来衡量。
注:查全率recall在医学上经常被称为真阳性率(True Positive Rate,TPR)。)
假阳性率(False Positive Rate,FPR):在医学上又称误诊率,等于 1 - 特异性(Specificity)。
假阴性率(False Negative Rate,FNR):在医学上又称漏诊率,等于 1 - 灵敏性(Sensitivity)。
在做疾病检测时,我们希望尽可能地把疾病检测出来,但同时也不想检测结果的准确率太低,因为这样会造成恐慌和不必要的医疗支出(偏向recall)。这时就要用到PR曲线。
PR曲线:x轴为查全率recall,y轴为查准率precision
应用场景:需要根据需求找到对应的precision和recall值。如果偏向precison,那就是在保证recall的情况下提升precision;如果偏向recall,那就是在保证precision的情况下提升recall。一般来说,提高二分类模型的分类阈值就能提高precision,降低分类阈值就能提高 recall,这时便可观察PR 曲线,根据自己的需要,找到最优的分类阈值(threshold)。
7.Which of the following machine learning algorithms can be used for inputting missing values of both categorical and continuous variables?
- K-means clustering
- Linear regression
- K-NN (k-nearest neighbor)
- Decision trees
The K nearest neighbor algorithm can be used because it can compute the nearest neighbor and if it doesn't have a value, it just computes the nearest neighbor based on all the other features.
When you're dealing with K-means clustering or linear regression, you need to do that in your pre-processing, otherwise, they'll crash. Decision trees also have the same problem, although there is some variance.
KNN imputation is a technique for filling in missing values by estimating them based on the characteristics of similar neighboring data points. It is referred to as multivariate because it considers multiple variables or features in the dataset to estimate the missing values. By leveraging the values of other variables
8. After studying the behavior of a population, you have identified four specific individual types that are valuable to your study. You would like to find all users who are most similar to each individual type. Which algorithm is most appropriate for this study?
Choose the correct option:
- K-means clustering
- Linear regression
- Association rules
- Decision trees
As we are looking for grouping people together specifically by four different similarities, it indicates the value of k. Therefore, K-means clustering (answer A) is the most appropriate algorithm for this study.
9. Your organization has a website where visitors randomly receive one of two coupons. It is also possible that visitors to the website will not receive a coupon. You have been asked to determine if offering a coupon to website visitors has any impact on their purchase decisions. Which analysis method should you use?
- One-way ANOVA
- K-means clustering
- Association rules
- Student's t-test
The answer is A: One-way ANOVA
One-way ANOVA is a statistical method to test the null hypothesis (H0) that three or more population means are equal vs. the alternative hypothesis (Ha) that at least one mean is different.
10. what is star schema
A star schema is used to denormalize business data into dimensions (like time and product) and facts (like transactions in amounts and quantities). A star schema has a single fact table in the center, containing business "facts" (like transaction amounts and quantities).
11. What are the types of biases that can occur during sampling?
- Selection bias
- Undercoverage bias
- Survivorship bias
12.
What is a bias-variance trade-off?
Bias: Due to an oversimplification of a Machine Learning Algorithm, an error occurs in our model, which is known as Bias. This can lead to an issue of underfitting and might lead to oversimplified assumptions at the model training time to make target functions easier and simpler to understand.
Some of the popular machine learning algorithms which are low on the bias scale are -
Support Vector Machines (SVM), K-Nearest Neighbors (KNN), and Decision Trees.
Algorithms that are high on the bias scale -
Logistic Regression and Linear Regression.
Variance: Because of a complex machine learning algorithm, a model performs really badly on a test data set as the model learns even noise from the training data set. This error that occurs in the Machine Learning model is called Variance and can generate overfitting and hyper-sensitivity in Machine Learning models.
While trying to get over bias in our model, we try to increase the complexity of the machine learning algorithm. Though it helps in reducing the bias, after a certain point, it generates an overfitting effect on the model hence resulting in hyper-sensitivity and high variance.
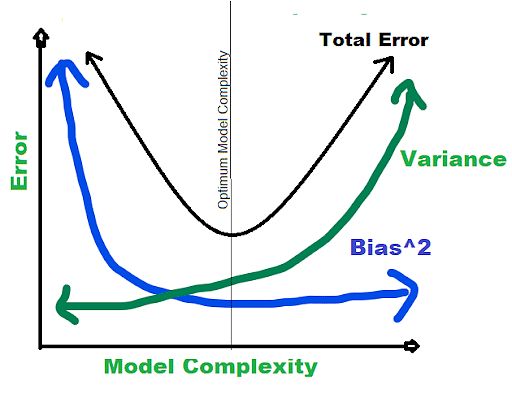
Bias-Variance trade-off: To achieve the best performance, the main target of a supervised machine learning algorithm is to have low variance and bias.
13.
Standardization(标准化)
为什么要标准化
在实际应用中使用机器学习的方法,由于数据会有多个维度,假设一个数据集有5种特征,其中4种数据都比较规则,均值为0,方差在一个数量级上(比如,都在10以下),如果另一种数据的方差比其它四种大一个数量级(比如,100多),那么这个数据可能就会主导目标函数,使得模型无法像预期的那样正确对待其他数据特征。
标准化被广泛用作许多学习算法中的预处理步骤,用来将特征缩放到零均值和单位方差(例如:normally distributed data (e.g. Gaussian with 0 mean and unit variance)正态分布数据(零均值和单位方差的高斯分布))。
归一化(normalization)
针对一个数据维度的操作。(例:可以简单的认为就是对DataFrame中一列进行操作)将数据范围缩放至[0,1]或者[-1,1]。将数据按比例缩放,使之落入一个小的特定区间。在某些比较和评价的指标处理中经常会用到,去除数据的单位限制,将其转化为无量纲的纯数值,便于不同单位或量级的指标能够进行比较和加权。
14. Based on your experience in the industry, tell me about your top 5 predictions for the next 10 years.
- AI continues to evolve, becoming an integral part of daily life, driving innovation in healthcare, education, and transportation.
- Climate change initiatives reshape economies, with renewable energy, electric vehicles, and sustainable practices mainstream.
- Advances in biotech lead to breakthroughs in personalized medicine and anti-aging therapies.
- Virtual and augmented reality become widespread, transforming entertainment, work, and social interactions.
- Cryptocurrencies and blockchain technologies gain wide acceptance, changing the financial landscape.
15.If we give you a random data set, how will you figure out whether it suits the business needs or not?
To ensure a random dataset suits business needs, first understand the business objectives and key performance indicators. Then, assess the dataset's relevance, quality, and completeness with respect to these objectives. If necessary, perform exploratory data analysis to uncover patterns or trends. Confirm that the dataset contains actionable insights that can drive business decisions.
16. KPI
KPIs, or key performance indicators, are metrics that measure the progress of a specific project toward your defined goals. KPIs need to be quantifiable and relevant, and should provide concrete evidence to make project decisions going forward.