矢 杂货店
In the ecommerce shopping experience product recommendations come in many forms: they may be used to recommend other products on one product’s page (Amazon’s “Frequently bought together” feature for instance) or they may be used on the checkout page to show customers products they may be interested in based on their total order. In this post I will detail how I made a recommender for the former case.
在电子商务购物体验中,产品推荐有多种形式:它们可以用于在一个产品页面上推荐其他产品(例如,亚马逊的“经常一起购买”功能),或者可以在结帐页面上用于向客户展示他们可能会使用的产品对他们的总订单感兴趣。 在这篇文章中,我将详细介绍如何为前一种情况推荐。
Further, recommendations may be more helpful if they are targeted towards a specific segment of customers, rather than made uniformly. For instance if one group of customers tends to buy a lot of nondairy milk substitutes and another group tends to buy traditional milk, it may make sense to make different recommendations to go along with that box of Cheerios. In order to make tailored recommendations I first segmented Instacart users based on their purchase history using K-Means clustering and then made recommenders based on the product association rules within those clusters. In this post I will go through that process and give samples of recommendations.
此外,如果建议针对特定的客户群而不是统一提出,则可能会更有帮助。 例如,如果一组顾客倾向于购买很多非乳制品替代品,而另一组顾客倾向于购买传统乳制品,那么与那盒Cheerios一起提出不同的建议可能是有意义的。 为了提出定制的建议,我首先使用K-Means聚类根据购买历史对Instacart用户进行了细分,然后根据这些聚类中的产品关联规则制定了推荐者。 在这篇文章中,我将介绍该过程并给出建议示例。
The Data and Instacart Background
数据和Instacart背景
Instacart is an online grocery delivery service that allows users to place grocery orders through their website or app which are then fulfilled and delivered by a personal shopper- very similar to Uber Eats but for grocery stores. In 2017 they released a year of their data composed of about 3.3 million orders from about 200,000 customers. Released in the form of a relational database, I combined the separate tables together to perform EDA, leaving me with the following:
Instacart是一项在线杂货配送服务,允许用户通过其网站或应用程序下达杂货订单,然后由个人购物者完成和交付-与Uber Eats非常相似,但适用于杂货店。 在2017年,他们发布了一年的数据,其中包括来自约200,000个客户的约330万笔订单。 以关系数据库的形式发布,我将单独的表组合在一起以执行EDA,剩下以下内容:

EDA
EDA
When performing EDA there were some key questions I wanted to answer:
在执行EDA时,我想回答一些关键问题:
- What are the most popular products and aisles? 最受欢迎的产品和过道是什么?
- How “top heavy” was the assortment? That is, how much of the total ordering share do the top products make up? 这些分类有多“重”? 也就是说,顶级产品占总订购份额的多少?
- How large are orders? 订单多大?
To get a broad idea of what Instacart tends to sell we can defer to their department sales. Instacart has 21 departments at the top of their product taxonomy. Below are the unit sale shares for each of them:
为了对Instacart倾向于销售什么有一个广泛的了解,我们可以服从他们的部门销售。 Instacart在其产品分类法的顶部有21个部门。 以下是它们各自的单位销售份额:

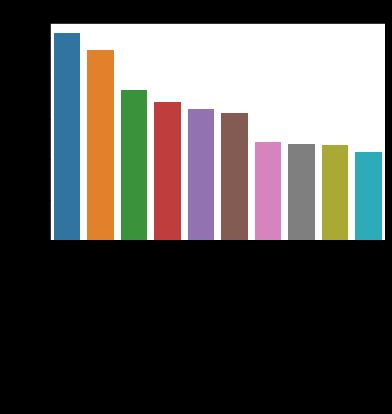
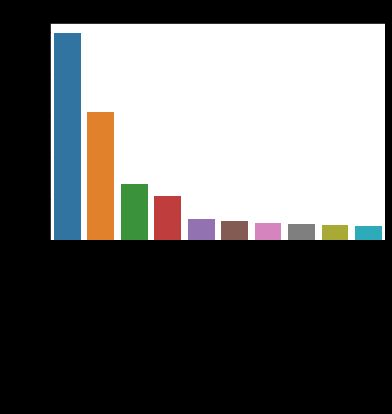
Instacart seems to be a popular choice for produce. The most popular Instacart “aisles,” the next level down in their taxonomy, are their fruit and vegetable aisles, the below chart showing unit share of total sales for the top 10 aisles:
Instacart似乎是农产品的热门选择。 最受欢迎的Instacart“过道”是其水果和蔬菜过道,是其分类法中的下一个等级。下图显示了排名前10位的过道在总销售额中所占的份额:

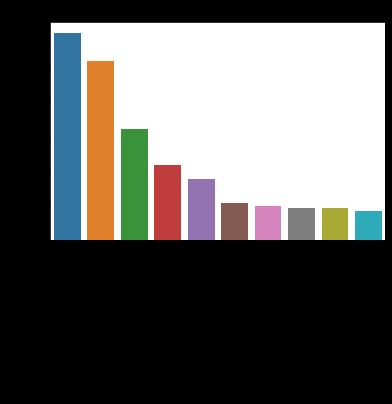
There are 134 aisles in total with 49685 products so the above chart indicates quite a “top heavy” distribution in terms of product sales with the top 3 aisles accounting for over 25% of units sold. The below chart, showing unit shares for the top 3 products follows the same trend:
总共有134个过道,提供49685个产品,因此上图显示,在产品销售方面,分布相当“繁重”,前3个过道占销量的25%以上。 下图显示了前3种产品的单位份额遵循相同的趋势:
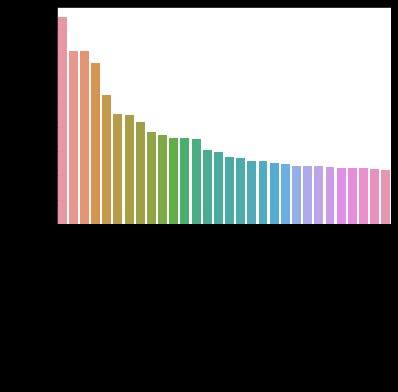
Almost all of the top 30 products are produce and there is a steep drop-off in terms of share after the most popular items. It will be interesting to see if K-Means clustering may reveal distinct customer groups from this produce-heavy distribution.
排名前30位的产品几乎全部是农产品,在最受欢迎的产品之后,份额所占比例急剧下降。 有趣的是,看看K-Means聚类法是否可以从这种大量生产的分布中揭示出不同的客户群。
Below are the descriptive characteristics of order size:
以下是订单大小的描述性特征:
count    3.346083e+06
mean     8.457334e+01
std      1.355298e+02
min      1.000000e+00
25%      1.500000e+01
50%      3.600000e+01
75%      1.050000e+02
max      1.058500e+04
Here is a distribution chart with a cutoff at 500 units:
这是一个截止值为500个单位的分布图:

The chart and table indicate that Instacart may have room to improve considering order size- the right skewed distribution indicating that most orders may not be fulfilling all the grocery needs for their respective customers with half of the orders having less than 36 items. A product recommendation system would allow customers to more easily find products they want and expose customers to items they have never bought from Instacart.
图表和表格表明,Instacart可能会考虑订单大小而有改进的空间-正确的偏斜分布表明大多数订单可能无法满足其各自客户的所有杂货需求,其中一半订单少于36件。 产品推荐系统将使客户能够更轻松地找到他们想要的产品,并使客户接触从未购买过的Instacart产品。
PCA and K-Means Clustering
PCA和K-Means聚类
The goal for the K-Means clustering is to group customers into segments based on the products they have bought historically. To accomplish this I intended to implement K-Means on the share of units bought from the sum of each customer’s previous orders. My first step was to transform the combined table I displayed earlier into a table where each row represents a customer and the columns represent the share bought from each aisle. A sample from this table is below:
K-Means聚类的目标是根据客户过去购买的产品将客户分组。 为此,我打算对从每个客户先前的订单总和中购买的份额份额实施K-Means。 我的第一步是将我先前显示的合并表转换成一个表,其中每一行代表一个客户,各列代表从每个过道购买的份额。 该表的示例如下:

I then performed PCA to reduce the number of features for the K-Means algorithm. This would allow me to better visualize my clusters as well as help K-Means run more efficiently. In deciding on the number of components to use I referred to the variance % each component represented of the total variance and chose a cutoff after the marginal variance added leveled off:
然后,我执行了PCA,以减少K-Means算法的功能数量。 这将使我能够更好地可视化群集,并帮助K-Means更有效地运行。 在确定要使用的成分数时,我用方差%表示每个成分代表总方差,并在添加的边际方差趋于平稳之后选择一个截断值:
from sklearn.decomposition import PCA
import matplotlib.pyplot as plt
pca = PCA(n_components = 30)
principalComponents = pca.fit_transform(aisle_share_pivot)features = range(pca.n_components_)
plt.bar(features, pca.explained_variance_ratio_, color = 'black')
plt.xlabel('PCA features')
plt.ylabel('variance %')
plt.xticks(features)
plt.xticks(rotation = 45)PCA_components = pd.DataFrame(principalComponents)
The component this happened at according to the chart was at component 5. I then fit sci-kit-learn’s K-Means algorithm on the 6 PCA components and looked at the resulting SSE curve:
根据图表,发生的组件位于组件5。然后,将sci-kit-learn的K-Means算法拟合到6个PCA组件上,并查看生成的SSE曲线:
from sklearn.cluster import KMeans
import matplotlib.pyplot as plt
sse = {}
labels = {}
for k in range(2,15):
    kmeans = KMeans(n_clusters = k).fit(PCA_components[[0,1,2,3,4,5]])
    sse[k] = kmeans.inertia_
    labels[k] = kmeans.labels_
plt.figure()
plt.plot(list(sse.keys()), list(sse.values()))
plt.xlabel("Number of cluster")
plt.ylabel("SSE")
plt.show()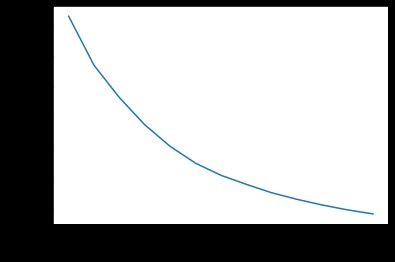
It seems that the curve starts to flatten at cluster 5 so I moved forward with 6 clusters. Here are those clusters plotted on a scatterplot matrix of the 6 PCA components:
似乎曲线在簇5开始变平,因此我向前移动了6个簇。 以下是在6个PCA组件的散点图矩阵上绘制的那些群集:
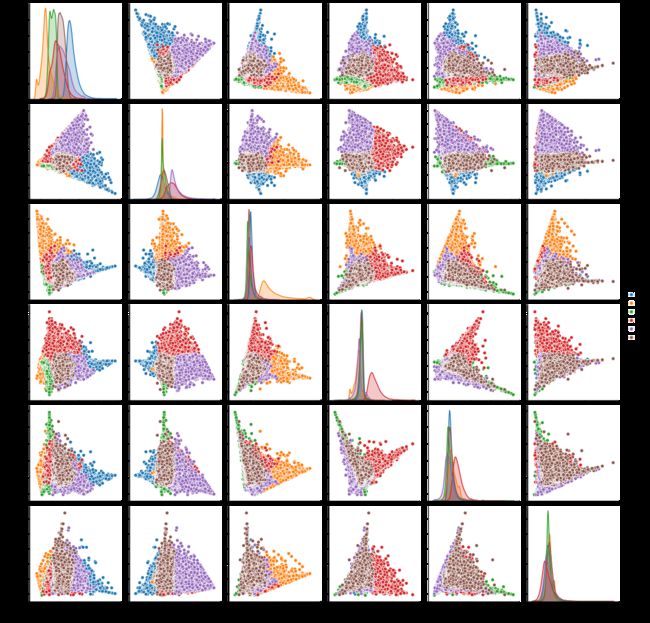
Though not perfect, it does seem that I have identified 6 distinct groups that should result in differences in aisle purchase history. The best way to check this of course is to look at each cluster’s aisle share for unit purchases. Below is a heatmap for share of purchases by aisle for the top 20 Instacart aisles:
尽管并不完美,但看来我已经确定了6个不同的群体,这些群体应导致过道购买历史的差异。 当然,最好的检查方法是查看每个集群的过道份额以进行单位购买。 以下是有关Instacart前20个过道的过道购买份额的热图:

There are clear differences for the 6 clusters, with the most obvious being the relative amounts they buy fresh fruits and fresh vegetables. This makes sense given that produce makes up over 25% of Instacart unit sales. The differences for each cluster may be better brought out by looking at them each individually, which I do in the charts below:
这六个集群之间存在明显的差异,最明显的是他们购买新鲜水果和新鲜蔬菜的相对数量。 考虑到产品占Instacart单位销售额的25%以上,这是有道理的。 通过分别查看每个群集,可以更好地找出每个群集的差异,我在下图中进行了操作:


Cluster 0 are heavy vegetable shoppers, cluster 1 seems to mainly use Instacart for beverages, cluster 2 has a more balanced palette, cluster 3 prefers packaged produce, cluster 4 are heavy fruit shoppers and cluster 5 buy fresh fruits and vegetables almost equally. Differences may also be noticed looking into the less frequently bought aisles, for instance “baby food formula” is the 8th most purchased aisle for cluster 5 but does not appear in the top 10 for any other cluster.
类别0是重蔬菜的购物者,类别1似乎主要使用Instacart饮料,类别2的调色板更均衡,类别3更喜欢包装产品,类别4是重水果购物者,类别5几乎相等地购买新鲜水果和蔬菜。 在购买频率较低的过道上也可能会发现差异,例如,“婴儿食品配方”是类别5中购买次数最多的第八条通道,但在其他类别中未出现在前10名中。
It is also of interest for Instacart’s business is the size of these clusters in terms of number of users and buying power. The table below shows the percent of users belonging to each cluster in the left column and the percent of unit purchases belonging to each cluster on the right.
对于Instacart的业务来说,还很有趣的是,这些集群的规模在用户数量和购买力方面均如此。 下表在左列显示了属于每个群集的用户百分比,在右侧显示了属于每个群集的单位购买百分比。

Interestingly, cluster 5 represents about 35% of the users but almost 50% of the unit purchases. Recall that this cluster’s most bought aisles were fresh fruits and fresh vegetables but in equal amounts and also featured baby food formula in its top 10 aisles. This suggests that this cluster may contain users using Instacart for shopping for families with babies and young children, appearing to be Instacart’s most important customers. An entire project may be carrying this analysis further to isolate Instacart’s best customers! At this point, however, I move forward to creating the product recommender.
有趣的是,集群5代表约35%的用户,但几乎占单位购买的50%。 回想一下,该集群中购买最多的过道是新鲜水果和新鲜蔬菜,但数量相同,并且在其前十个过道中还包含婴儿食品配方。 这表明该集群可能包含使用Instacart的用户,他们似乎是Instacart最重要的客户,他们在有婴儿和幼儿的家庭购物。 整个项目可能会进一步进行分析,以找出Instacart的最佳客户! 但是,在这一点上,我将继续创建产品推荐器。
Association Rule Mining
关联规则挖掘
With the 200,000 users broken up into cluster I was ready to perform basket analysis via association rule mining on orders. This worked by splitting the total orders table into 6 tables for the 6 different clusters and finding association rules between each product. Association rules specify the relationships products have with each other in terms of how likely they are to be bought together in the same order.
将200,000个用户分解到集群中后,我准备通过对订单进行关联规则挖掘来执行购物篮分析。 通过将总订单表分为6个不同集群的6个表并找到每个产品之间的关联规则来进行工作。 关联规则指定了产品之间以相同顺序一起购买的可能性。
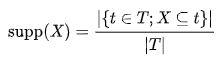
Three of the common rules are support, confidence and lift. Support is simply the frequency an itemset appears in a dataset and is computed by dividing the frequency by the size of the dateset (via Wikipedia):
支持,信任和提升是三个常见规则。 支持只是项目集在数据集中出现的频率,其计算方法是将频率除以日期集的大小(通过Wikipedia):
Confidence is the proportion of transactions containing one item that also contain another item and computed by dividing the support of one or more items by the support of a subset of the numerator, via Wikipedia:
置信度是包含一项的交易也包含另一项的交易的比例,通过Wikipedia通过将一个或多个项目的支持除以分子子集的支持来计算:
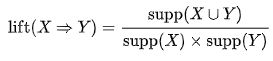
Lift is the ratio of the observed frequency of two or more items over the expected frequency. It indicates if two or more items occur more frequently than they would if they appeared together randomly. A value greater than one indicating a non-random relationship. Formula below:
升力是两个或多个项目的观察频率与预期频率的比率。 它指示两个或多个项目是否比随机出现在一起的频率更高。 大于1的值表示非随机关系。 公式如下:
I computed these metrics by cluster for all items over a minimum support of .01% using a python script employing generators. This was necessary given the size of the dataset (3.3 million orders containing about 50,000 products). The table below shows the output sorted by lift for cluster 5:
我使用生成器的python脚本按群集为所有项目计算了这些指标,且最小支持率为.01%。 考虑到数据集的大小(330万个订单包含大约50,000种产品),这是必要的。 下表显示了集群5的按提升排序的输出:
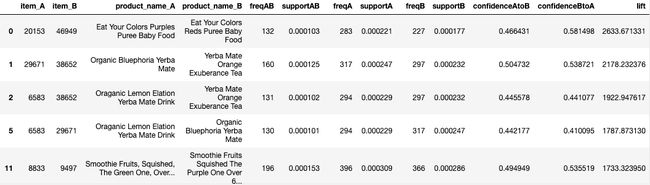
As can be seen the highest lift values of the entire dataset are of products similar to each other as can be expected.
可以看出,整个数据集的最高提升值是彼此相似的产品。
Product Recommender
产品推荐人
To perform the product recommendations to be displayed on a product’s page I wrote a python script that takes in user_id, product_id, desired lift cutoff and num_products to be returned. With these inputs it determines the cluster of the user (stored in a dataframe outputted from the cluster analysis), filters the dataframe containing the product association rules for that cluster and returns the specified number of products with a lift greater than the lift input, prioritizing the items with the greatest lift. If there are less items than the num_products that meet the criteria it will return all products that do meet the criteria. The code for the recommender may find in the Github repository, link at the end of the article.
为了执行要在产品页面上显示的产品推荐,我编写了一个python脚本,该脚本接受了user_id,product_id,所需的提升截止值和num_products返回。 使用这些输入,它确定用户的群集(存储在从群集分析输出的数据框中),过滤包含该群集的产品关联规则的数据框,并返回指定数量的产品,其提升度大于提升输入,从而确定优先级具有最大提升力的物品。 如果符合条件的商品少于num_products,它将返回所有符合条件的商品。 推荐程序的代码可以在Github存储库中找到,该链接位于文章末尾。
In the below I show the recommender in action, showing the outputs for “organic whole milk” for the 5 clusters limited to 5 items.
在下面的内容中,我将展示推荐器的运行情况,其中显示5个组中限于5个项目的“有机全脂牛奶”的输出。
cluster 0['Whole Milk Plain Yogurt', 'YoBaby Blueberry Apple Yogurt', 'Organic Muenster Cheese', 'Apples + Strawberries Organic Nibbly Fingers', 'Yo Toddler Organic Strawberry Banana Whole Milk Yogurt']

cluster 1['Beef Tenderloin Steak', 'Original Dairy Free Coconut Milk', 'Pumpkin & Blueberry Cruncy Dog Treats', 'MRS MEYERS   12.5OZ HANDSOAP RHUBAR', 'Organic Sprouted Whole Grain Bread']

cluster 2['Whole Milk Plain Yogurt', 'Organic Skim Milk', "Elmo Mac 'n Cheese With Carrots & Broccoli", 'Kids Sensible Foods Broccoli Littles', 'Apples + Strawberries Organic Nibbly Fingers']

cluster 3['Organic Nonfat Milk', 'Paneer', 'Organic Whole Milk Yogurt', 'Organic Plain Yogurt', 'Extra Light Olive Oil']

cluster 4['Puffed Corn Cereal', 'String Cheese, Mozzarella', 'Cold-Pressed Sweet Greens & Lemon Juice', 'Organic Stage 2 Broccoli Pears & Peas Baby Food', 'Superberry Kombucha']

cluster 5['Whole Milk Plain Yogurt', 'YoTot Organic Raspberry Pear Yogurt', 'Organic Atage 3 Nibbly Fingers Mangoes Carrots', "Elmo Mac 'n Cheese With Carrots & Broccoli", 'Blueberry Whole Milk Yogurt Pouch']
The above lists all contain the products with the highest lift associated with organic whole milk for each cluster. What may stick out is that cluster 1’s recommendations don’t make as much intuitive sense as the other clusters’ recommendations. This is most likely because this cluster makes up less than 1% and of unit purchases and less than 2% of users and seems to leverage Instacart specifically for non-milk beverages. Further work would be required to determine if fewer clusters would be optimal but generating non-intuitive recommendations isn’t so much of an issue considering users from this group are not likely to view a milk product anyway. For another example on a less general use product, here are the results from “Mild Salsa Roja”:
上面列出的每个类别中,所有包含与有机全脂奶相关的提升量最高的产品。 可能会出现的是,群集1的建议没有其他群集的建议那么直观。 这是最有可能的,因为该集群仅占单位购买量的不到1%,占用户的不到2%,并且似乎将Instacart专门用于非牛奶饮料。 考虑到来自该组的用户不太可能查看乳制品,因此需要进一步的工作来确定最佳集群是否是最佳集群,但是生成非直觉的建议并不是什么大问题。 对于不那么通用的产品的另一个示例,以下是“ Mild Salsa Roja”的结果:
cluster 0['Thin & Light Tortilla Chips', 'Red Peppers', 'Organic Lemon', 'Organic Cucumber', 'Organic Grape Tomatoes']cluster 2['Real Guacamole', 'Thin & Light Tortilla Chips', 'Original Hummus', 'Organic Reduced Fat 2% Milk', 'Thick & Crispy Tortilla Chips']cluster 4['Organic Raspberries', 'Banana', 'Organic Strawberries', 'Organic Hass Avocado']cluster 5['Thin & Light Tortilla Chips', 'Organic Large Brown Grade AA Cage Free Eggs', 'Organic Reduced Fat 2% Milk', 'Organic Large Grade AA Brown Eggs', 'Thick & Crispy Tortilla Chips']Cluster 1 and cluster 3 did not have any items with a lift over 1 for this product.
集群1和集群3没有该产品的提升超过1的项目。
That’s it for now! The link to the GitHub with the Jupyter Notebooks is here.
现在就这样! Jupyter Notebooks链接到GitHub的链接在这里。
翻译自: https://medium.com/@alexellman/creating-a-grocery-product-recommender-for-instacart-c1b6bdf5ae13
矢 杂货店