uniapp 使用renderjs引入echarts
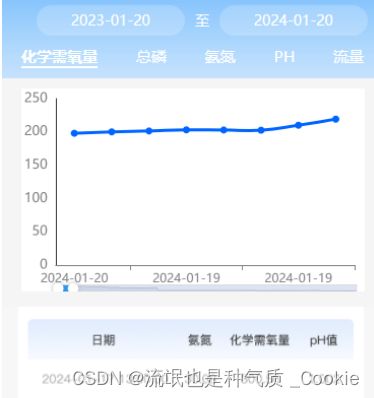
效果图:
1.1renderjs引入echarts
组件zmui-echarts.vue:
2.使用
import zmuiEcharts from '@/components/zmui-echarts/zmui-echarts.vue'
components: {
zmuiEcharts
},