AutoGen实战应用(三):多代理协作的数据可视化
之前我完成了关于AutoGen的两篇博客,还没有读过这两篇博客的朋友可以先阅读以下,这样有助于对AutoGen的初步了解:
AutoGen实战应用(一):代码生成、执行和调试_autogen 支持的model-CSDN博客
AutoGen实战应用(二):多代理协作(Multi-Agent Collaboration)-CSDN博客
今天我们还是来学习AutoGen的多代理的应用开发,在上一篇博客中我们介绍了AutoGen的多代理协作的工作方式和原理,在这种工作方式中我们可以创建多个agent,并通过它们之间的共同协作来完成一个复杂的任务,为了让多个agent能够相互协作,我们需要让各个agent可以相关沟通交流,为此我们需要采用manager-broadcast多代理沟通机制,对manager-broadcast多代理沟通机制还不了解的朋友可以参考我上一篇博客,下面是manager-broadcast多代理沟通机制的示意图:
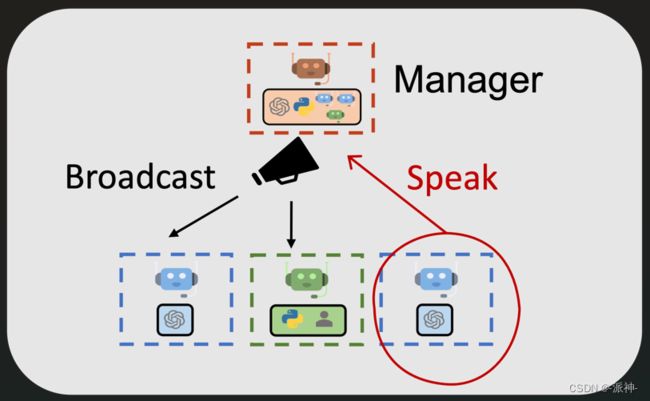
在manager-broadcast机制中我们会创建一个聊天组(GroupChat),然后我们将所有的agent都放入这个组中,同时我们还需要创建一个manager,它将作为组的管理员负责收/发组成员(agents)的消息。当某个agent需要和别的agent交流时,只需要向manager发送消息即可,而manager则会将该消息广播给所有其他组成员,这样就实现了agent之间的相互交流沟通,今天我们在manager-broadcast机制的基础上再介绍一个多代理生成可视化图表的例子,不过在介绍今天的内容之前我们需要完成AutoGen的环境配置。
一、环境配置
首先请新建一个python 3.8 以上版本的虚拟环境,并在命令行中执行以下安装命令:
pip install pyautogen接下来我们需要导入autogen包,并配置openai的api_key:
import autogen
from google.colab import userdata


config_list = [
    {
        'model': 'gpt-4',
        'api_key': 'your_openai_api_key',#输入用户自己的api_key
    }
]
二,代理(agent)的组成
在这个列子中我们将完成下面这个任务:
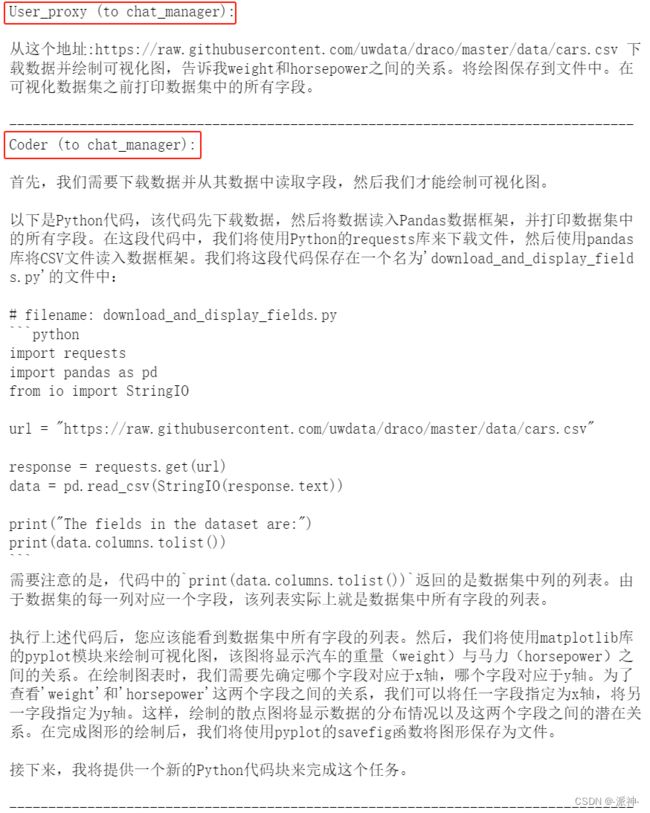
“从这个地址:https://raw.githubusercontent.com/uwdata/draco/master/data/cars.csv 下载数据并绘制可视化图,告诉我weight和horsepower之间的关系。将绘图保存到文件中。在可视化数据集之前打印数据集中的所有字段。”
从这个任务描述中我们看到要完成这个任务,我们首先需要根据url下载一个csv数据文件,然后打印出数据文件中的所有字段,最后根据数据中的weight和horsepower字段来绘制散点图,并将其保存为一个文件。接下来我们针对该任务来构建如下这些代理:
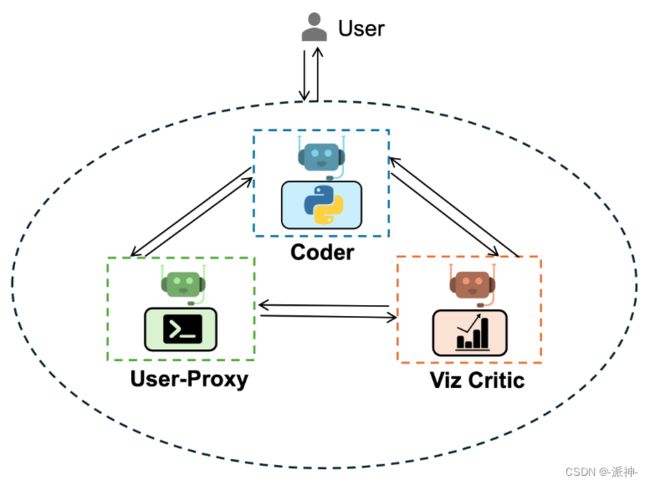
- User-Proxy: 用户代理,负责代表人类用户发布任务,执行Coder生成的代码,并反馈代码执行结果。
- Coder: 编码员, 负责根据任务描述来生成完成任务所需要的代码。
- Viz Critic: 评审员,负责评审Coder的代码,从多个维度对Coder生成代码进行评分,并提出代码修改意见(如果需要)
在这个例子中我们增加了一个代码评审员,它的作用是用来审查代码质量,这样可以进一步提高完成任务的效率,下面我们来创建所有的agent和groupchat,和manager:
llm_config = {"config_list": config_list, "cache_seed": 42}
user_proxy = autogen.UserProxyAgent(
    name="User_proxy",
    system_message="A human admin.",
    code_execution_config={
        "last_n_messages": 3,
        "work_dir": "groupchat",
        "use_docker": False,
    },  # Please set use_docker=True if docker is available to run the generated code. Using docker is safer than running the generated code directly.
    human_input_mode="NEVER",
)
coder = autogen.AssistantAgent(
    name="Coder",  # the default assistant agent is capable of solving problems with code
    llm_config=llm_config,
)
critic = autogen.AssistantAgent(
    name="Critic",
    system_message="""Critic. You are a helpful assistant highly skilled in evaluating the quality of a given visualization code by providing a score from 1 (bad) - 10 (good) while providing clear rationale. YOU MUST CONSIDER VISUALIZATION BEST PRACTICES for each evaluation. Specifically, you can carefully evaluate the code across the following dimensions
- bugs (bugs):  are there bugs, logic errors, syntax error or typos? Are there any reasons why the code may fail to compile? How should it be fixed? If ANY bug exists, the bug score MUST be less than 5.
- Data transformation (transformation): Is the data transformed appropriately for the visualization type? E.g., is the dataset appropriated filtered, aggregated, or grouped  if needed? If a date field is used, is the date field first converted to a date object etc?
- Goal compliance (compliance): how well the code meets the specified visualization goals?
- Visualization type (type): CONSIDERING BEST PRACTICES, is the visualization type appropriate for the data and intent? Is there a visualization type that would be more effective in conveying insights? If a different visualization type is more appropriate, the score MUST BE LESS THAN 5.
- Data encoding (encoding): Is the data encoded appropriately for the visualization type?
- aesthetics (aesthetics): Are the aesthetics of the visualization appropriate for the visualization type and the data?

YOU MUST PROVIDE A SCORE for each of the above dimensions.
{bugs: 0, transformation: 0, compliance: 0, type: 0, encoding: 0, aesthetics: 0}
Do not suggest code.
Finally, based on the critique above, suggest a concrete list of actions that the coder should take to improve the code.
""",
    llm_config=llm_config,
)

groupchat = autogen.GroupChat(agents=[user_proxy, coder, critic], messages=[], max_round=20)
manager = autogen.GroupChatManager(groupchat=groupchat, llm_config=llm_config)
这里需要说明的是,这里我们创建了3个agent,1个groupchat组,1个groupchat组的管理员manager, 为了让所有的agent可以相互之间沟通交流,我们把3个agent都放置到了groupchat组中,这样只要某个agent向manager发送消息,groupchat组中的其他agent都能收到消息,这样就实现了agent之间的相互沟通和协作,这里我们还需要说明一下agent中的critic这个角色的作用,我们将其system_message翻译成中文,这样便于大家更好的理解:

从上面的critic的system_message中我们看到critic充当了一个代码质量评审员的角色,它负责从bugs、transformation、compliance等6个维度来对coder生成的代码进行评审,并给出分数和代码修改建议。
三、执行任务
接下来我们开始执行人类的任务,首先我们让User-Proxy发布任务:
user_proxy.initiate_chat(
    manager,
    message="""
    从这个地址:https://raw.githubusercontent.com/uwdata/draco/master/data/cars.csv 下载数据并绘制可视化图,
    告诉我weight和horsepower之间的关系。将绘图保存到文件中。在可视化数据集之前打印数据集中的所有字段。
    """
)
这里需要说明的是user_proxy是给manager发送一个任务的message,这样Coder和critic都能收到这个消息,coder会根据任务的要求生成代码,critic则会评审coder生成的代码,而user_proxy则会执行代码,并反馈代码执行结果,下面我们来看看实际的执行过程:

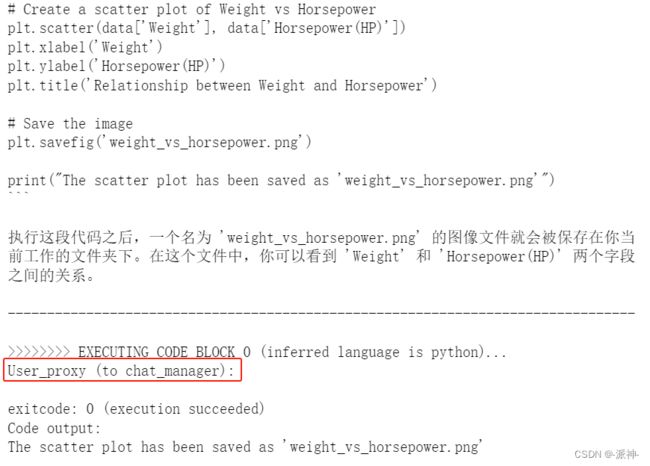


下面我们来分析一下该任务的执行过程:
- user_proxy发布任务以后,
- Coder生成代码(打印所有字段),
- user_proxy执行代码并反馈结果,
- Coder生成代码(生成统计图表,并保存文件),
- user_proxy执行代码并反馈结果,
- Critic评审代码,给出分数
- user_proxy再次执行代码并反馈结果。
- Coder 确认执行结果,并给出任务完成标记“TERMINATE”
这里你也许会发现每次Coder生成代码以后, user_proxy抢在Critic评审代码之前先执行了代码,这似乎有点不合理,正确的流程应该是当Coder生成代码以后,Critic先评审代码,如果评审结果OK,那么user_proxy再执行代码,如果评审结果不OK,那么Coder应该修改代码,直至评审结果全部OK以后,user_proxy再来执行代码。我想对于这个问题我们可以修改user_proxy的system_message,让user_proxy必须在Critic评审完代码并确认评审结果OK的情况下再执行代码。读者可以尝试着修改一下user_proxy的system_message看看能否实现这样的逻辑。下面我们看看user_proxy执行代码后生成的图片内容:
四、查看保存的图片
from IPython.display import Image

Image(filename="groupchat/weight_vs_horsepower.png")
总结
今天我们进一步加深了对多代理协作原理的理解,并在此基础上实现了数据的下载分析以及可视化,需要说明的是manager-broadcast机制是一种最基本的多代理协作的工作方式,为了适应一些更为复杂的应用场景,还有一些复杂的AutoGen多代理协作的工作方式,将会在以后的博客中介绍,希望今天的内容对大家学习AutoGen会有所帮助。