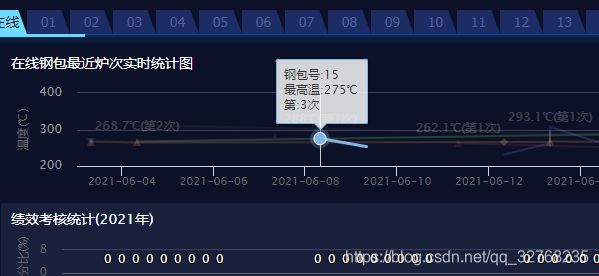
Highcharts 折线图显示多个属性数据
1.数据结构
[{ "name": "事件1", "data": [{ "x": toUTC("2021-07-10 10:10:01"), "y": 4, "z": 'aaa' }, { "x": toUTC("2021-07-11 10:10:01"), "y": 4, "z": 'aaa' }, { "x": toUTC("2021-07-12 10:10:01"), "y": 4, "z": 'aaa' }] }]
2.组织数据
var OnLine = [];//在线的
    function SearchBSonlineLadlesUsedTimes() {
        $.post("/Home/SearchBSonlineLadlesUsedTimes", {}, function (result) {
            var v = eval(result);
            let array = [];
            for (var i = 0; i < v.length; i++) {
                var c = array.filter(d=>d.name == v[i].ladleNO);
                if (c.length > 0) {
                    c[0].data.push({ x: toUTC(formatDate(new Date(parseInt(v[i].createTime.substr(6))))), y: v[i].maxTemp, z: v[i].usedTimes });
                } else {
                    OnLine.push(v[i].ladleNO);
                    array.push({ name: v[i].ladleNO, data: [{ x: toUTC(formatDate(new Date(parseInt(v[i].createTime.substr(6))))), y: v[i].maxTemp, z: v[i].usedTimes }] });
                }
            }
            Show1("sstjt", array);
        });
    }
3.显示
function Show1(id, array) {
        Highcharts.setOptions({
            time: {
                useUTC: false
            }
        });
        var sstjt = Highcharts.chart(id, {
            chart: {
                type: 'line',
                //inverted: true
                backgroundColor: 'rgba(0,0,0,0)',
            },
            title: {
                text: '在线钢包最近炉次实时统计图',
                style: {
                    color: '#fff',
                    fontSize: '14px',

                },
                align: 'left',
                verticalAlign: 'top',
            },
            credits: {
                enabled: false//不显示LOGO
            },
            subtitle: {
                text: null
            },
            xAxis: {
                type: 'datetime',
                labels: {
                    step: 1,//x轴间隔
                    formatter: function () {
                        return Highcharts.dateFormat('%Y-%m-%d', this.value);//%Y-%m-%d %H:%M
                    }
                }
            },
            yAxis: {
                title: {
                    text: '温度(℃)',
                },
                labels: {
                    formatter: function () {
                        return this.value + '';
                    },
                    style: {
                        color: '#999',
                        fontSize: '12px'
                    }
                },
                lineWidth: 0,
                lineColor: '#666',
                gridLineWidth: 1,
                gridLineColor: '#3b4159',
                gridLineDashStyle: 'solid',
            },
            colors: ['#7cb5ec', '#434348', '#90ed7d', '#f7a35c', '#8085e9', '#f15c80', '#e4d354', '#8085e8', '#8d4653', '#91e8e1'],
            legend: {
                enabled: true,
                align: 'right',
                verticalAlign: 'top',
                y: -50,
                itemStyle: { cursor: 'pointer', color: '#fff', fontWeight: 'none', },
                itemHiddenStyle: { color: '#666' },
                itemHoverStyle: { color: '#666' },
                itemDistance: 5
            },
            tooltip: {
                crosshairs: true,
                shared: false,//鼠标移上去分开显示数据标签
                headerFormat: '钢包号:{series.name}',
                pointFormat: '
最高温:{point.y}℃
第:{point.z}次'
            },
            plotOptions: {
                spline: {
                    lineWidth: 2,
                    states: {
                        hover: {
                            lineWidth: 2
                        }
                    },
                    marker: {
                        enabled: false
                    }
                },
                line: {
                    dataLabels: {
                        // 开启数据标签
                        enabled: true,
                        pointFormat: '{point.y}℃(第{point.z}次)',
                        style: {
                            color: '#fff',
                            fontSize: '12px',
                            fontWeight: 'none'
                        }
                    },
                    // 关闭鼠标跟踪,对应的提示框、点击事件会失效
                    enableMouseTracking: true
                }
            },
            series: array//[{ "name": "事件1", "data": [{ "x": toUTC("2021-07-10 10:10:01"), "y": 4, "z": 'aaa' }, { "x": toUTC("2021-07-11 10:10:01"), "y": 4, "z": 'aaa' }, { "x": toUTC("2021-07-12 10:10:01"), "y": 4, "z": 'aaa' }] }]
        });
    }
    //转UTC时间
    function toUTC(time) {
        var date = new Date(time);
        var y = date.getUTCFullYear();
        var m = date.getUTCMonth();
        var d = date.getUTCDate();
        var h = date.getUTCHours();
        var M = date.getUTCMinutes();
        var s = date.getUTCSeconds();
        return Date.UTC(y, m, d, h, M, s);
    }
    function formatDate(date) {
        var d = new Date(date),
          month = '' + (d.getMonth() + 1),
          day = '' + d.getDate(),
          year = d.getFullYear();

        if (month.length < 2) month = '0' + month;
        if (day.length < 2) day = '0' + day;

        return [year, month, day].join('-');
    }
