React中echarts封装,包括图例、图表的点击事件、控制tooltip显隐
1、基于echarts,在react中的封装,包括图例的取消/选中事件监听、图表的点击事件、控制显示tooltip
2、事件相关代码可根据需求,需要交互的可以直接用,只渲染图的话可以删除
3、使用时传入对应图表的option,option可根据echarts官方文档配置
有问题或者需要其他扩展的可以私信
1、echarts封装
import React, { useCallback, useEffect, useRef } from 'react';
// 引入 echarts 核心模块,核心模块提供了 echarts 使用必须要的接口。
import * as echarts from 'echarts/core';
// 引入 Canvas 渲染器,注意引入 CanvasRenderer 或者 SVGRenderer 是必须的一步
import { CanvasRenderer } from 'echarts/renderers';
// 设备分辨率
const dpr = window.devicePixelRatio;

interface Props {
  options: any;
  components: any;
  renderType?: any;
  style?: React.CSSProperties;
}

const Chart = ({ renderType = 'canvas', options, style, components = [] }: Props) => {
  const chartRef = useRef();
  const chartInstance = useRef(null);

  //初始化图表,设置配置项
  const renderChart = useCallback(() => {
    const render = echarts?.getInstanceByDom(chartRef.current);
    if (render) {
      chartInstance.current = render;
    } else {
      chartInstance.current = echarts?.init(chartRef.current, null, {
        renderer: renderType,
      });
    }
    chartInstance.current?.setOption(options);
    // 图例选中/取消选中事件
    chartInstance.current?.on('legendselectchanged', (e: any) => {

    });
    // 图表的点击事件
    chartInstance.current?.getZr()?.on('click', (e: any) => {
      const pointInPixel = [e.offsetX, e.offsetY];
      if (chartInstance.current?.containPixel('grid', pointInPixel)) {

      }
      // 显示tooltip
      chartInstance.current?.dispatchAction({
        type: 'showTip',
        x: e?.event?.offsetX,
        y: e?.event?.offsetY,
      });
    });
  }, [chartRef, options, renderType]);

  useEffect(() => {
    // 注册必须的组件
    echarts?.use([CanvasRenderer, ...components]);
  }, []);

  //监听屏幕变化,重绘图表
  useEffect(() => {
    window.addEventListener('resize', handleResize);
    return () => {
      window.removeEventListener('resize', handleResize);
    };
  });

  useEffect(() => {
    renderChart();
    return () => {
      const { current } = chartInstance ?? {};
      if (current) {
        current.dispose();
      }
    };
  }, [chartInstance, renderChart]);

  const handleResize = () => {
    const chart = chartInstance?.current;
    if (chart) {
      chart.resize();
    }
  };

  return (
    <div
      ref={chartRef}
      style={{
        height: `${260 * dpr}px`,
        width: `calc(100vw - .32rem)`,
        ...style,
      }}
    />
  );
};

export default Chart;
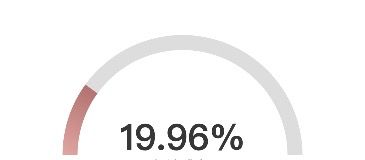
2、使用(下边是仪表盘图表配置)
import React from 'react';
// 引入柱状图图表,图表后缀都为 Chart
import { GaugeChart } from 'echarts/charts';
// 引入封装好的组件
import Chart from '../Chart';

import styles from './index.less';

const getOption = (progress) => {
  return {
    series: {
      type: 'gauge',
      radius: '160%',
      center: ['50%', '100%'],
      startAngle: 180,
      endAngle: 0,
      min: 0,
      max: 100,
      splitNumber: 12,
      itemStyle: {
        color: {
          type: 'linear',
          x: 1,
          y: 0,
          x2: 0,
          y2: 1,
          colorStops: [
            {
              offset: 0,
              color: '#A6746B',
            },
            {
              offset: 1,
              color: '#DAABA2',
            },
          ],
        },
      },
      progress: {
        show: true,
        width: 30,
      },

      pointer: {
        show: false,
      },
      axisLine: {
        lineStyle: {
          width: 30,
          color: [[1, '#ddd']],
        },
      },
      axisTick: {
        show: false,
      },
      splitLine: {
        show: false,
      },
      axisLabel: {
        show: false,
      },
      anchor: {
        show: false,
      },
      title: {
        show: false,
      },
      detail: {
        valueAnimation: true,
        width: '60%',
        lineHeight: 40,
        height: '15%',
        borderRadius: 8,
        offsetCenter: [0, '-15%'],
        fontSize: 72,
        fontWeight: 'bolder',
        formatter: '{value}%',
        color: '#373737',
      },
      data: [
        {
          value: progress,
        },
      ],
    },
  };
};

export default ({ progress }) => {
  return (
    <Chart
        style={{ height: '40vw' }}
        options={getOption(progress)}
        components={[GaugeChart]}
    />
  );
};
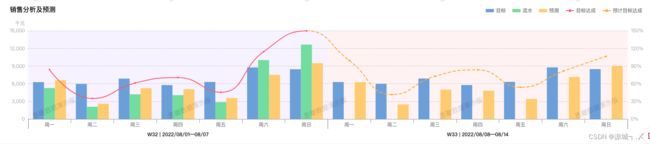
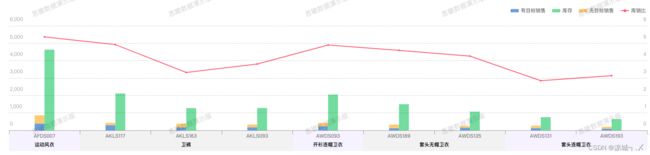
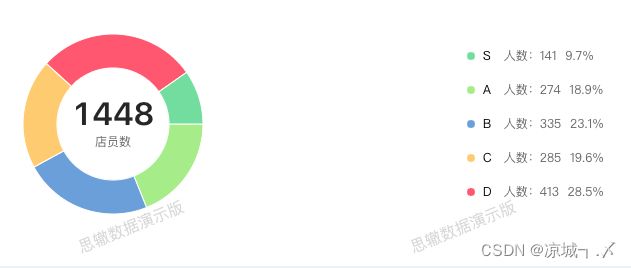
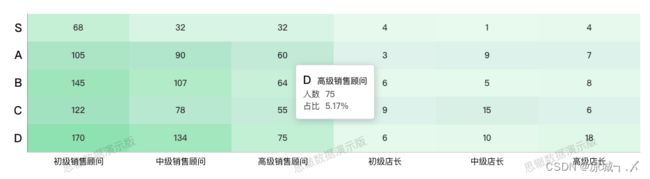
3、效果图