Prometheus搭建SpringBoot监控环境

SpringBoot程序通过Actuator接口访问,每次只能拿到当前状态的数据,如果想要统计分析监控数据,那么应该拿到每一个时刻的监控数据,存储到数据库中,并进行可视化展示。
在微服务场景下,针对于SpringBoot程序的监控,Spring全家桶提供有SpringBootAdmin组件。如果不考虑微服务的情况,可以使用NodeExporter监控SpringBoot程序所运行的主机信息(Cpu、内存等),使用Actuator监控SpringBoot程序的运行信息。使用Prometheus采集监控数据存储到Nosql数据库中,使用Grafana将监控数据作为图表展示。

准备3台服务器,分别当作服务主机、数据采集服务器和可视化服务器。
| No. | 主机名 | 作用 | 运行程序 |
|---|---|---|---|
| 1 | centos7001 | 服务主机 | SpringBoot、PrometheusActuator、NodeExporter |
| 2 | centos7002 | 数据采集服务器 | Prometheus、AlterManager |
| 3 | centos7003 | 可视化服务器 | Grafana |
一、 NodeExporter服务搭建
node_exporter用于采集服务器层面的运行指标,包括机器的loadavg、filesystem、meminfo等基础监控
登录Prometheus的官方站点进行NodeExporter的下载(官方站点地址)。

点击DOWNLOAD下载node_exporter。
选择Linux版本下载,点击下载。

使用ftp工具将node_exporter上传至centos7001的usr/local/software文件夹下。

解压node_exporter:
tar -zxvf node_exporter-1.3.0.linux-amd64.tar.gz
切换到node_exporter-1.3.0.linux-amd64文件夹,发现只有node_exporter文件一个可执行文件。编写脚本,将其添加到系统服务中,这样可以在系统启动时自动启动node_exporte服务。

vi /etc/systemd/system/node-exporter.service
粘贴脚本,ExecStart需要指定node_exporter的执行文件。
[Unit]
Description=Prometheus Node Exporter

[Service]
User=root
ExecStart=/usr/local/software/node_exporter-1.3.0.linux-amd64/node_exporter
TimeoutStopSec=10
Restart=on-failure
RestartSec=5

[Install]
WantedBy=multi-user.target
重新加载,设置开启自启动。
systemctl daemon-reload
systemctl enable node-exporter
systemctl start node-exporter
查看node-exporter服务状态,启动后的node_exporter会占用9100端口。
systemctl status node-exporter.service

设置防火墙开放9100端口,否则其他主机无法访问node_exporter。
firewall-cmd --zone=public -add-port=9100/tcp --permanent
重启防火墙,激活上一步的配置。
firewall-cmd --reload
二、Prometheus监控数据提供
如果想要使用Prometheus监控SpringBoot程序,那么应该将Actuator监控得到的数据提供给Prometheus。
项目引入micrometer-registry-prometheus依赖。
<dependency>
    <groupId>io.micrometergroupId>
    <artifactId>micrometer-registry-prometheusartifactId>
dependency>
micrometer-registry-prometheus组件可以将Actuator监控到的数据转换为符合Prometheus格式要求的数据,只需要进行端口的开放即可。
server:
  port: 8080
management:
  server:
    port: 9090
  endpoints:
    web:
      exposure:
        include: "*"
      base-path: /actuator
执行bootJar任务,将SpringBoot程序打成jar包,使用ftp工具上传到centos7001中的usr/local/software/jar文件夹。

后台启动SpringBoot程序:
java -jar spring-boot-actuator-project-1.0.0.jar&

开启8080端口和9090端口,并重启防火墙。
firewall-cmd --zone=public -add-port=8080/tcp --permanent
firewall-cmd --zone=public -add-port=9090/tcp --permanent
firewall-cmd --reload
在外部使用浏览器访问:http://centos7001:9090/actuator/health,出现status=up,则配置成功。

三、搭建Prometheus服务端
在官方站点下载Prometheus(下载地址)。

使用ftp工具将prometheus压缩包上传至centos7002的/usr/local/software文件夹下。

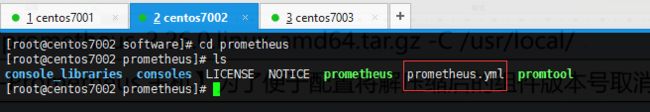
解压prometheus安装包。
tar -zxvf prometheus-2.31.1.linux-amd64.tar.gz
为方便配置,重命名prometheus安装目录。
mv prometheus-2.31.1.linux-amd64 ./prometheus
进入目录,修改prometheus.yml文件。
cd prometheus
vim prometheus.yml
# 全局配置
global:
  scrape_interval: 15s # 数据的抓取间隔
  evaluation_interval: 15s # 数据评估的间隔时间
  # scrape_timeout is set to the global default (10s).

# 警告配置
alerting:
  alertmanagers:
    - static_configs:
        - targets:
          # - alertmanager:9093

# 规则文件
rule_files:
  # - "first_rules.yml"
  # - "second_rules.yml"

scrape_configs:
  - job_name: "prometheus"
    static_configs:
      - targets: ["centos7002:9999"]
  - job_name: "node"
    static_configs:
      - targets: ["centos7001:9100"]
        labels:
          instance: spring-boot-app
  - job_name: "springboot"
    scrape_interval: 10s # 数据的抓取间隔
    scrape_timeout: 5s # 5s未获取的数据则超时
    metrics_path: '/actuator/prometheus' # actuator提供prometheus格式数据的接口
    static_configs:
      - targets: ["centos7001:9090"]
检查配置文件是否正确。
./promtool check config prometheus.yml
将prometheus注册到service,设置开机时自启动。
vi /etc/systemd/system/prometheus.service
[Unit]
Description=Prometheus

[Service]
User=root
ExecStart=/usr/local/software/prometheus/prometheus \
          --config.file=/usr/local/software/prometheus/prometheus.yml \
          --storage.tsdb.path=/usr/local/software/prometheus/data \
          --web.listen-address=0.0.0.0:9999 --web.enable-lifecycle
TimeoutStopSec=10
Restart=on-failure
RestartSec=5

[Install]
WantedBy=multi-user.target
加载全部服务文件:systemctl daemon-reload
配置prometheus 服务自启动:systemctl enable prometheus
启动prometheus 服务:systemctl start prometheus
查看prometheus 服务状态:systemctl status prometheus

查看prometheus 占用端口:
netstat -nptl

开启9999端口并重启防火墙。
firewall-cmd --zone=public -add-port=9999/tcp --permanent
firewall-cmd --reload
prometheus 配置完成后,通过浏览器访问监控界面,访问路径:http://centos7002:9999
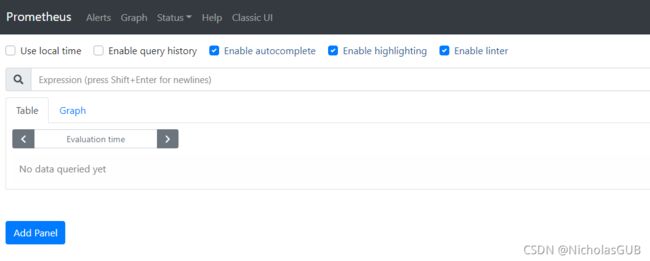
可以直接在搜索框查询监听的内容:

点击Targets可以查看监听数据的来源。


四、Grafana图表统计
使用Grafana能够将监控到的数据进行更加清晰的统计展示,此次在centos7003上部署Grafana服务(Grafana下载地址)。

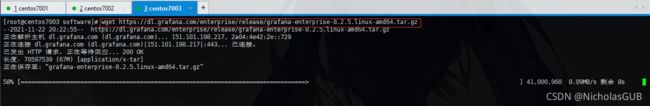
切换到/usr/local/software文件夹,执行wget命令获取grafana安装包。
wget https://dl.grafana.com/enterprise/release/grafana-enterprise-8.2.5.linux-amd64.tar.gz
解压到当前文件夹:tar -zxvf grafana-enterprise-8.2.5.linux-amd64.tar.gz
重命名解压文件夹:mv grafana-8.2.5 grafana
进入grafana文件夹,查看目录结构:

同上面安装的NodeExporter和Prometheus一样,为grafana创建服务并配置开机自启动。
新建grafana服务配置文件。
vi /etc/systemd/system/grafana.service
[Unit]
Description=Grafana

[Service]
User=root
ExecStart=/usr/local/software/grafana/bin/grafana-server \
          -config /usr/local/software/grafana/conf/defaults.ini \
          -homepath /usr/local/software/grafana
TimeoutStopSec=10
Restart=on-failure
RestartSec=5

[Install]
WantedBy=multi-user.target
加载全部服务文件:systemctl daemon-reload
配置grafana服务自启动:systemctl enable grafana
启动grafana服务:systemctl start grafana
查看grafana服务状态:systemctl status grafana

grafana服务启动后会占用3000端口,需要对外暴露3000端口并重启防火墙。
firewall-cmd --zone=public -add-port=3000/tcp --permanent
firewall-cmd --reload
Grafana配置完成后,访问:http://centos7003:3000进入到登录页。

输入默认的用户名:admin,密码:admin,进入Grafana控制台。

此时的Grafana并不能取得监控数据,需要在控制台配置Prometheus数据源,这样才能生成数据报表。
点击:设置–>Add data source

选择Prometheus。


数据源配置完成后,点击Dashboard进行面板的创建,此时可选择监控数据的类型。

返回到主页后,监控的数据已经可以用折线图显示了。

五、AlterManager警报服务
altermanager是prometheus下的一个子模块,可以在prometheus监控数据异常时发出警报。此次在centos7002上安装altermanager,altermanager可以在prometheus官网直接下载(下载地址)。

将下载好的安装包使用ftp工具上传到centos7002的/usr/local/software文件夹下。

解压安装包:tar -zxvf alertmanager-0.23.0.linux-amd64.tar.gz
重命名文件夹:mv alertmanager-0.23.0.linux-amd64 alertmanager
进入altermanager文件夹,查看其文件结构如下:

警报信息在altermanager.yml文件中配置。
global配置项:
| No | 配置项 | 解释 |
|---|---|---|
| 1 | resolve_timeout | 解析超时配置 |
| 2 | smtp_from | 发件人邮箱地址 |
| 3 | smtp_smarthost | 发件人对应邮件提供商的smtp地址 |
| 4 | smtp_auth_username | 发件人的登陆用户名,默认和发件人地址一致 |
| 5 | smtp_auth_password | 发件人的登陆密码,有时候是授权码 |
| 6 | smtp_require_tls | 是否需要tls协议。默认是true |
| 7 | wechart_api_url | 微信api地址 |
| 8 | wechart_api_secret | 密码 |
| 9 | wechat_api_corp_id | corp id 信息 |
route配置项:
| No | 配置项 | 解释 |
|---|---|---|
| 1 | group_by | 数据路由配置 |
| 2 | group_wait | 等待时间 |
| 3 | group_interval | 分组间隔 |
| 4 | repeat_interval | 邮件重复发送间隔 |
| 5 | receiver | 警告媒体类型 |
vim alertmanager.yml
global:
  resolve_timeout: 5m
  smtp_smarthost: 'smtp.qq.com:25'
  smtp_from: '[email protected]'
  smtp_auth_username: '[email protected]'
  smtp_auth_password: 'xxxxxxxx' # 你自己的密码
  smtp_require_tls: false
route:
  group_by: ['alertname']
  group_wait: 30s
  group_interval: 5m
  repeat_interval: 1h
  receiver: 'mail'
receivers:
- name: 'mail'
  email_configs:
  - to : '[email protected]'
检查配置文件是否正确。
./amtool check-config alertmanager.yml

将altermanager注册到service,设置开机时自启动。
vim /etc/systemd/system/altermanager.service
[Unit]
Description=Altermanager

[Service]
User=root
ExecStart=/usr/local/software/alertmanager/alertmanager  \
          --config.file=/usr/local/software/alertmanager/alertmanager.yml
TimeoutStopSec=10
Restart=on-failure
RestartSec=5

[Install]
WantedBy=multi-user.target
加载全部服务文件:systemctl daemon-reload
配置altermanager服务自启动:systemctl enable altermanager
启动altermanager 服务:systemctl start altermanager
查看altermanager服务状态:systemctl status altermanager
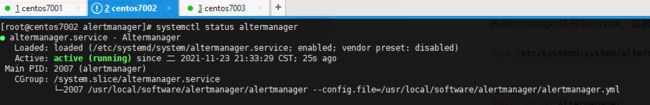
alertmanager启动后会占用9093和9094两个端口,防火墙打开这两个端口。

firewall-cmd --zone=public -add-port=9093/tcp --permanent
firewall-cmd --zone=public -add-port=9094/tcp --permanent
firewall-cmd --reload
此时虽然配置好了alertmanager服务,但是其没有和prometheus产生关联。
修改prometheus的配置文件:
vim /usr/local/software/prometheus/prometheus.yml
# 警告配置
alerting:
  alertmanagers:
    - static_configs:
        - targets:
           - centos7002:9093
配置报警规则:
mkdir -p /usr/local/software/prometheus/rules
创建两个规则,一个针对微服务,一个针对服务器主机。
vim /usr/local/software/prometheus/rules/springboot-acutator-rule.yml
groups:
- name: springboot.actuator.rules
  rules:
  - alert: MicrobootInstanceDown
    expr: up{job="springboot"} == 0
    for: 1m
    labels:
      severity: warning
    annotations:
      description: "微服务 {{ $labels.instance }} 关闭"
      summary: "运行在 {{ $labels.instance }} 主机中的 {{ $labels.job }} 微服务已经关闭了!"
vim /usr/local/software/prometheus/rules/springboot-node.yml
groups:
- name: springboot.node.rules
  rules:
  - alert: NodeCPUUsage
    expr: 100 - (avg(irate(node_cpu_seconds_total{mode="idle"}[5m])) by (instance) * 100) > 80
    for: 2m
    labels:
      severity: warning
    annotations:
      summary: "微服务运行主机 {{ $labels.instance }} 中的CPU使用率过高"
      description: "微服务运行主机 {{ $labels.instance }} 中的CPU使用大于80%,当前值: “{{ $value }}”"
  - alert: NodeMemoryUsage
    expr: 100 - (node_memory_MemFree_bytes+node_memory_Cached_bytes+node_memory_Buffers_bytes) / node_memory_MemTotal_bytes * 100 > 80
    for: 2m
    labels:
      severity: warning
    annotations:
      summary: "微服务运行主机 {{ $labels.instance }} 中的内存使用率过高"
      description: "微服务运行主机 {{ $labels.instance }} 内存使用大于 80%,当前值: {{ $value }}"
  - alert: NodeFilesystemUsage
    expr: 100 - (node_filesystem_free_bytes{fstype=~"ext4|xfs"} / node_filesystem_size_bytes{fstype=~"ext4|xfs"} * 100) > 90
    for: 2m
    labels:
      severity: warning
    annotations:
      summary: "微服务运行主机 {{ $labels.instance }}中的“{{ $labels.mountpoint }}” 分区使用过高"
      description: "微服务运行主机 {{ $labels.instance }} 中 {{ $labels.mountpoint }} 分区使用大于80%,当前值: {{ $value }}"
修改了prometheus配置文件,指定规则的位置。
rule_files:
  - "rules/*.yml"
再次检查配置文件格式是否正确:./promtool check config ./prometheus.yml

由于修改了prometheus配置文件,想要修改项生效,则需重启prometheus服务。
systemctl restart prometheus
访问prometheus控制台:http://centos7002:9999/alerts,发现规则全部配置成功。
