大厂都在用的监控高可用方案,小公司还不赶紧学起来?
有一次在一家国企时,他们是使用的docker+nginx做为自己的“云”。同时,监控告警平台也不完善,虽然使用的是Prometheus+Grafana,但仅仅是用来“看大屏”。
同时所有的报警都是一个一个的脚本去写的,例如写一个python脚本去查询ES、查询MySQL,达到阈值调用一下钉钉webhook。并且散落在各台服务器上面。导致一人离职,其余人都不知道告警从哪里发出,整体瘫痪。
就,有种宝马车轱辘安装在奶奶家的二八大杠上面的感觉。
概览:
- Thanos 搭建Prometheus高可用
- 搭建minio云存储
- 搭建Dingtalk对接钉钉告警
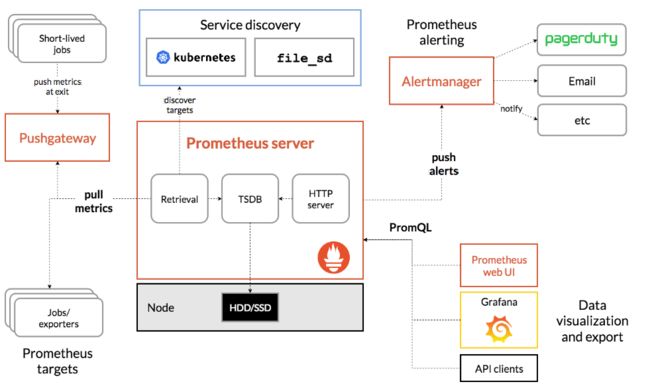
Prometheus 介绍
Prometheus是 基于 Go 语言开发,是一套开源的系统监控报警框架,能轻松支持上万台规模的集群。
优点
- 支持多维度数据模型,由
度量名和键值对组成的时间序列 - 支持
PromQL(Prometheus Queue language)查询语言,结合数据标签实现数据的聚合、切割、切片等功能 - 支持 HTTP pull 方式和 PushGateway 方式采集数据
- 支持服务发现和静态配置两种发现方式
- 原生支持K8S以及Grafana
缺点
- 不支持大量历史数据的存储,长期存储数据建议采用 Influxdb、OpenTSDB 等
- 集群不太成熟
本文内容便是介绍如何解决以上缺点。
Thanos 介绍
Thanos 是一个「开源的,高可用的 Prometheus 系统,具有长期存储能力」。很多知名公司都在使用 Thanos,也是 CNCF 孵化项目的一部分。
Thanos 的一个主要特点就是通过使用对象存储(比如 S3)可以允许 “无限” 存储空间。对象存储可以是每个云提供商提供的对象存储也可以是 ceph、rook 或 minio 这样的解决方案。
讲的通俗一点,Thanos能够将Prometheus采集的数据进行汇总、去重。
Thanos 组件介绍
Thanos Store(存储)
Thanos 存储充当一个网关,将查询转换为远程对象存储。它还可以在本地存储上缓存一些信息。基本上,这个组件允许你查询对象存储以获取指标。这个组件充当 Thanos 查询的存储。
Thanos Compactor(压缩器)
将对象存储中的数据进行压缩和降低采样率,加速大时间区间监控数据查询的速度。
Thanos Sidecar
连接 Prometheus,将其数据提供给 Thanos Query 查询,并且/或者将其上传到对象存储,以供长期存储。
架构如下:
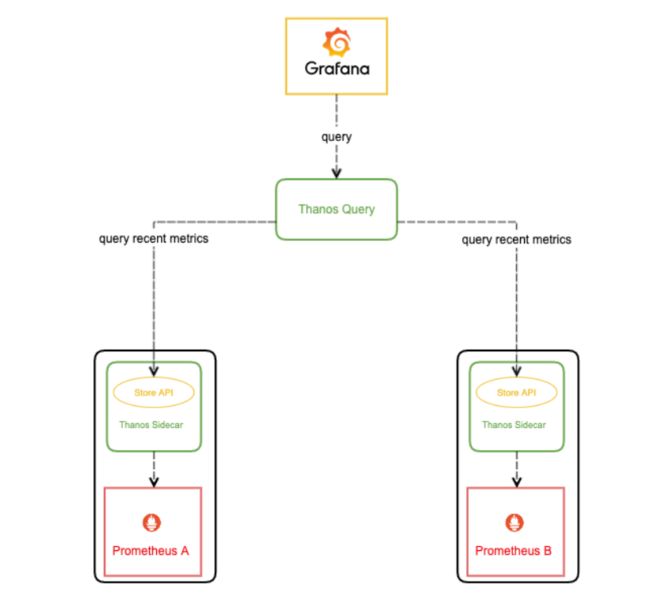
Thanos Query
Thanos Query(查询)是 Thanos 的主要组件,它是向其发送 PromQL 查询的中心点。Thanos 查询暴露了一个与 Prometheus 兼容的端点。然后它将查询分派给所有的 “stores”。记住,Store 可能是任何其他提供指标的 Thanos 组件。Thanos 查询可以发送查询到另一个 Thanos 查询(他们可以堆叠)。
Grafana 介绍
Grafana是一个开源的度量分析、监控可视化解决方案,支持很多种时序数据库,如graphite、InfluxDB、Prometheus、Elasticsearch等。
Dingtalk 介绍
搭建高可用监控
首先准备两台服务器,没太服务器上需要部署的环境如下:
| 服务器IP | 共同角色 | 单独角色 |
|---|---|---|
| 10.0.1.35 | prometheus1,sidecar1,store1,query1,alertmanager1, | grafana,compact,dingtalk |
| 10.0.1.36 | prometheus2,sidecar2,store2,query2,alertmanager2 |
为了更便捷部署,已经将两份docker-compose文件放置于文末,分别在两台机器上执行即可。
主要修改位置如下:
#将文件中所有的ip替换成自己的服务器节点ip,例如:
command:
      - --config.file=/alertmanager/alertmanager.yaml
      - --storage.path=/alertmanager
      - --web.external-url=http://10.0.1.36:9093
      - --cluster.listen-address=0.0.0.0:9094
      - --cluster.advertise-address=10.0.1.36:9094
      - --cluster.peer=10.0.1.35:9094
#配置文件中所有的磁盘挂载,将/u01 改成自己的目录即可。
volumes:
      - /u01/prometheus:/prometheus
# 修改thanos_store 的存储位置
# 我个人使用的是金山云存储。
#若没有线上存储库,可自行搭建minio存储即可。
config:
    bucket: monitor-data
    region: BEIJING
    endpoint: xxx
    access_key: xxx
    secret_key: xxx
    insecure: true
    signature_version2: true
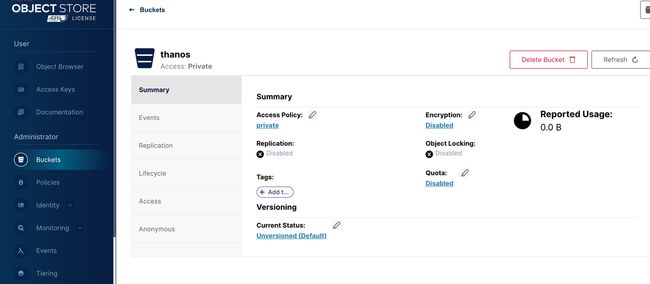
搭建minio
若没有线上存储桶,两台机器中单独找一台进行搭建即可(存储空间更大的那台)
创建成功后,将自己的存储桶endpoint、access_key、secret_key 替换docker-compose文件即可。
mkdir /data/domain_exporter/ -p
cat > /data/domain_exporter/start.sh << 'EOF'
docker run -d \
--name domain_exporter \
--restart=always \
-p 9222:9222 \
-v /etc/localtime:/etc/localtime:ro \
caarlos0/domain_exporter:v1
EOF
bash /data/domain_exporter/start.sh
- 访问minio
http://47.92.133.104:9001
帐号 : admin
密码 : admin123456
- 创建存储桶
Docker-compose 搭建高可用集群
docker-compose 文件中将dingtalk搭建已经注释掉了,若需要使用dingtalk组件发送告警信息,可去掉注释。
在服务器中分别执行文末的docker-compose文件
访问http://10.0.1.35:3000/login

访问http://10.0.1.35:10903/
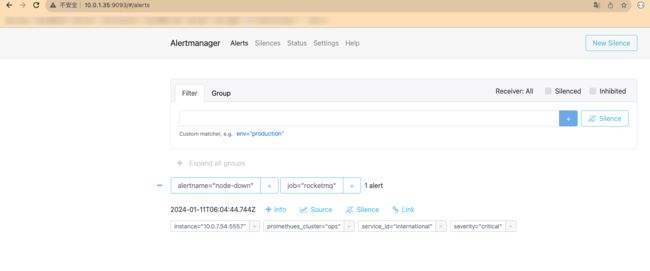
访问http://10.0.1.35:9093/#/alerts
10.0.1.35
version: '2'
services:
  #####################################
  # prometheus 1 on host 1
  #####################################
  prometheus:
    image: prom/prometheus:v2.45.0
    container_name: prometheus
    network_mode: host
    restart: always
    # ports:
    #   - "9090:9090"
    volumes:
      - /u01/prometheus:/prometheus
    command:
      - --config.file=/prometheus/prometheus.yaml
      - --storage.tsdb.path=/prometheus/data
      - --storage.tsdb.retention.time=30d
      - --storage.tsdb.min-block-duration=2h
      - --storage.tsdb.max-block-duration=2h
      - --storage.tsdb.no-lockfile
      - --web.listen-address=0.0.0.0:9090
      - --web.read-timeout=1m
      - --web.enable-admin-api
      - --web.max-connections=10
      - --query.max-concurrency=20
      - --query.timeout=2m
      - --web.enable-lifecycle
      - --log.level=info
      - --web.external-url=http://inside-prometheus.01zhuanche.com

      #  - --web.console.libraries=/usr/share/prometheus/console_libraries
      #  - --web.console.templates=/usr/share/prometheus/consoles

  #####################################
  # thanos sidecar 1  on host 1
  #####################################
  thanos_sidecar:
    image: thanosio/thanos:v0.32.5
    container_name: thanos_sidecar
    network_mode: host
    restart: always
    user: nobody
    volumes:
      - /u01/prometheus:/prometheus
    environment:
      - REPLICA=A
    command:
      - sidecar
      - --log.level=debug
      - --tsdb.path=/prometheus/data
      - --prometheus.url=http://localhost:9090
      - --http-address=0.0.0.0:10902
      - --grpc-address=0.0.0.0:10901
      - --reloader.rule-dir=/prometheus/rules/
      - --reloader.config-file=/prometheus/prometheus.yaml.tmpl
      - --reloader.config-envsubst-file=/prometheus/prometheus.yaml
      #- --objstore.config-file=/prometheus/bucket_config.yaml
      - |
        --objstore.config=type: S3
        config:
          bucket: monitor-data
          region: BEIJING
          endpoint: obs.cn-north-4.myhuaweicloud.com
          access_key: 0TN7LBPM3WPZRVNOXDCK
          secret_key: RHiEj2Ph0797jWkKcbUHhUvEnteaB2GRLmd65ZkQ
          insecure: true
          signature_version2: true
    depends_on:
      - prometheus


  #####################################
  # thanos store 1  on host 1
  #####################################
  thanos_store:
    image: thanosio/thanos:v0.32.5
    container_name: thanos_store
    network_mode: host
    restart: always
    user: nobody
    volumes:
      - /u01/thanos_store:/data
    command:
      - store
      - --log.level=debug
      - --data-dir=/data
      - --index-cache-size=500MB
      - --chunk-pool-size=500MB
      - --http-address=0.0.0.0:10906
      - --grpc-address=0.0.0.0:10905
      - |
        --objstore.config=type: S3
        config:
          bucket: monitor-data
          region: BEIJING
          endpoint: obs.cn-north-4.myhuaweicloud.com
          access_key: 0TN7LBPM3WPZRVNOXDCK
          secret_key: RHiEj2Ph0797jWkKcbUHhUvEnteaB2GRLmd65ZkQ
          insecure: true
          signature_version2: true

    depends_on:
      - prometheus


  #####################################
  # thanos compact 1  on host 1
  #####################################
  thanos_compact:
    image: thanosio/thanos:v0.32.5
    container_name: thanos_compact
    network_mode: host
    restart: always
    user: nobody
    volumes:
      - /u01/thanos_compact:/data
    command:
      - compact
      - --log.level=debug
      - --data-dir=/data
      - --http-address=0.0.0.0:10907
      - --wait
      - |
        --objstore.config=type: S3
        config:
          bucket: monitor-data
          region: BEIJING
          endpoint: xxx
          access_key: xxx
          secret_key: xxx
          insecure: true
          signature_version2: true
    depends_on:
      - prometheus


  #####################################
  # thanos query 1  on host 1
  #####################################
  thanos_query:
    image: thanosio/thanos:v0.32.5
    container_name: thanos_query
    network_mode: host
    restart: always
    command:
      - query
      - --query.replica-label=replica
      - --http-address=0.0.0.0:10903
      - --grpc-address=0.0.0.0:10904
      - --store=10.0.1.35:10901
      - --store=10.0.1.36:10901
      - --store=10.0.1.35:10905
      - --store=10.0.1.36:10905


  #####################################
  # alertmanager 1  on host 1
  #####################################
  alertmanager:
    image: prom/alertmanager:v0.25.0
    container_name: alertmanager
    network_mode: host
    restart: always
    volumes:
      - /u01/alertmanager:/alertmanager
    # ports:
    #   - "9093:9093"
    command:
      - --config.file=/alertmanager/alertmanager.yaml
      - --storage.path=/alertmanager
      - --web.external-url=http://10.0.1.35:9093
      - --cluster.listen-address=0.0.0.0:9094
      - --cluster.advertise-address=10.0.1.35:9094
      - --cluster.peer=10.0.1.36:9094


  #####################################
  # grafana  on host 1
  #####################################
  grafana:
    image: grafana/grafana-oss:10.1.1-ubuntu
    container_name: grafana
    network_mode: host
    restart: always
    user: "0:0"
    # ports:
    #   - "3000:3000"
    # user: $(id -u)
    environment:
      - GF_SECURITY_ADMIN_USER=admin
      - GF_SECURITY_ADMIN_PASSWORD=admin
      - GF_PATHS_CONFIG=/var/lib/grafana/conf/grafana.ini
      - GF_PATHS_PROVISIONING=/var/lib/grafana/conf/provisioning
      - GF_PATHS_DATA=/var/lib/grafana/data
      - GF_PATHS_PLUGINS=/var/lib/grafana/data/plugins
    volumes:
      - /u01/grafana:/var/lib/grafana
    depends_on:
      - prometheus


  ##########################################
  # prometheus dingtalk webhook  on host 1
  ##########################################
  #dingtalk-webhook:
  #  image: timonwong/prometheus-webhook-dingtalk:v2.1.0
  #  container_name: dingtalk-webhook
  #  network_mode: host
    # ports:
    #   - "8060:8060"
  #  volumes:
  #    - /u01/dingtalk-webhook:/etc/prometheus-webhook-dingtalk
  #  command:
  #    - --web.listen-address=:8060
  #    - --web.enable-ui
  #    - --web.enable-lifecycle
  #    - --config.file=/etc/prometheus-webhook-dingtalk/config.yaml
  #    - --log.level=info
10.0.1.36
version: '2'
services:
  #####################################
  # prometheus 2 on host 2
  #####################################
  prometheus:
    image: prom/prometheus:v2.45.0
    container_name: prometheus
    network_mode: host
    restart: always
    # ports:
    #   - "9090:9090"
    volumes:
      - /u01/prometheus:/prometheus
    command:
      - --config.file=/prometheus/prometheus.yaml
      - --storage.tsdb.path=/prometheus/data
      - --storage.tsdb.retention.time=1d
      - --storage.tsdb.min-block-duration=2h
      - --storage.tsdb.max-block-duration=2h
      - --storage.tsdb.no-lockfile
      - --web.listen-address=0.0.0.0:9090
      - --web.read-timeout=1m
      - --web.enable-admin-api
      - --web.max-connections=10
      - --query.max-concurrency=20
      - --query.timeout=2m
      - --web.enable-lifecycle
      - --log.level=info
      - --web.external-url=http://inside-prometheus.01zhuanche.com


  #####################################
  # thanos sidecar 2  on host 2
  #####################################
  thanos_sidecar:
    image: thanosio/thanos:v0.32.5
    container_name: thanos_sidecar
    user: nobody
    network_mode: host
    restart: always
    volumes:
      - /u01/prometheus:/prometheus
    environment:
      - REPLICA=B
    command:
      - sidecar
      - --log.level=debug
      - --tsdb.path=/prometheus/data
      - --prometheus.url=http://localhost:9090
      - --http-address=0.0.0.0:10902
      - --grpc-address=0.0.0.0:10901
      - --reloader.rule-dir=/prometheus/rules/
      - --reloader.config-file=/prometheus/prometheus.yaml.tmpl
      - --reloader.config-envsubst-file=/prometheus/prometheus.yaml
      - |
        --objstore.config=type: S3
        config:
          bucket: monitor-data
          region: BEIJING
          endpoint: obs.cn-north-4.myhuaweicloud.com
          access_key: 0TN7LBPM3WPZRVNOXDCK
          secret_key: RHiEj2Ph0797jWkKcbUHhUvEnteaB2GRLmd65ZkQ
          insecure: true
          signature_version2: true
    depends_on:
      - prometheus


  #####################################
  # thanos store 2  on host 2
  #####################################
  thanos_store:
    image: thanosio/thanos:v0.32.5
    container_name: thanos_store
    network_mode: host
    restart: always
    user: nobody
    volumes:
      - /u01/thanos_store:/data
    command:
      - store
      - --log.level=debug
      - --data-dir=/data
      - --index-cache-size=500MB
      - --chunk-pool-size=500MB
      - --http-address=0.0.0.0:10906
      - --grpc-address=0.0.0.0:10905
      - |
        --objstore.config=type: S3
        config:
          bucket: monitor-data
          region: BEIJING
          endpoint: xxx
          access_key: xxx
          secret_key: xxx
          insecure: true
          signature_version2: true

    depends_on:
      - prometheus


  #####################################
  # thanos query 2  on host 2
  #####################################
  thanos_query:
    image: thanosio/thanos:v0.32.5
    container_name: thanos_query
    network_mode: host
    restart: always
    command:
      - query
      - --query.replica-label=replica
      - --http-address=0.0.0.0:10903
      - --grpc-address=0.0.0.0:10904
      - --store=10.0.1.35:10901
      - --store=10.0.1.36:10901
      - --store=10.0.1.35:10905
      - --store=10.0.1.36:10905


  #####################################
  # alertmanager 2  on host 2
  #####################################
  alertmanager:
    image: prom/alertmanager:v0.25.0
    container_name: alertmanager
    network_mode: host
    restart: always
    volumes:
      - /u01/alertmanager:/alertmanager
    # ports:
    #   - "9093:9093"
    command:
      - --config.file=/alertmanager/alertmanager.yaml
      - --storage.path=/alertmanager
      - --web.external-url=http://10.0.1.36:9093
      - --cluster.listen-address=0.0.0.0:9094
      - --cluster.advertise-address=10.0.1.36:9094
      - --cluster.peer=10.0.1.35:9094