Prometheus如何使用 Push 方式采集目标服务器数据
公众号「架构成长指南」,专注于生产实践、云原生、分布式系统、大数据技术分享
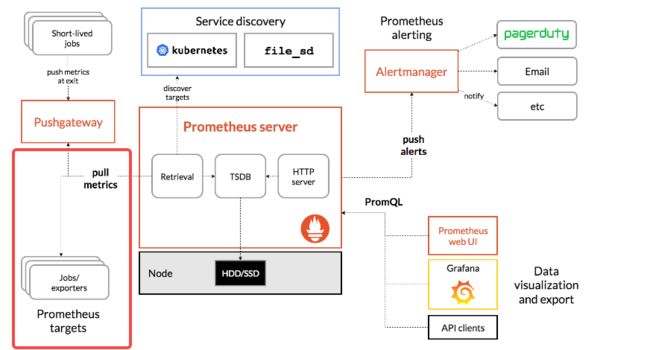
在上篇主要介绍了从零开始:使用Prometheus与Grafana搭建监控系统,我们了解了Prometheus采集数据主要是采用Pull模式,即主动拉取模式,这种方式虽然简单,但是有一定限制,比如服务器A部署在边缘端与Prometheus部署在云端,两者网络不通,因此不能采用Pull模式。
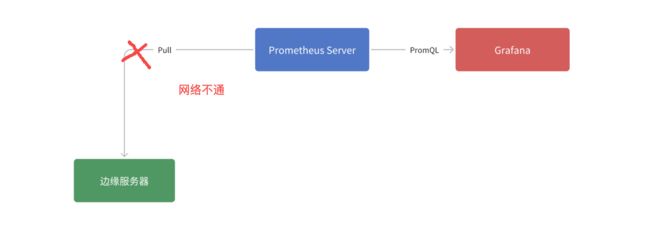
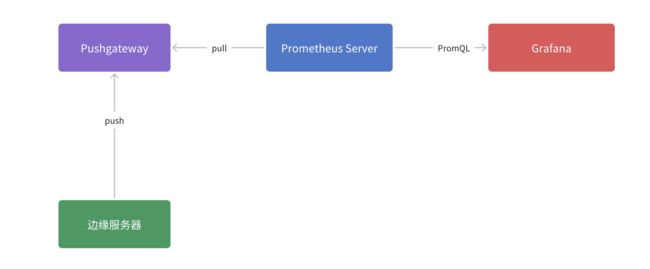
那么如何获取服务器 A 的指标?答案就是采用Pushgateway,这里Pushgateway充当了一个桥接的作用,把Pushgateway服务暴漏一个公网地址,然后服务器 A 与Prometheus都能连接即可。服务器 把数据 Push到Pushgateway,然后 Prometheus 去 Pushgateway 上定时 pull数据即可。
下面分享一下如何使用Pushgateway如何采集远程节点数据指标。
下载
docker pull prom/pushgateway:v1.5.1
启动
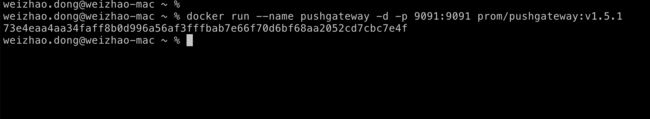
docker run --name pushgateway -d -p 9091:9091 prom/pushgateway:v1.5.1
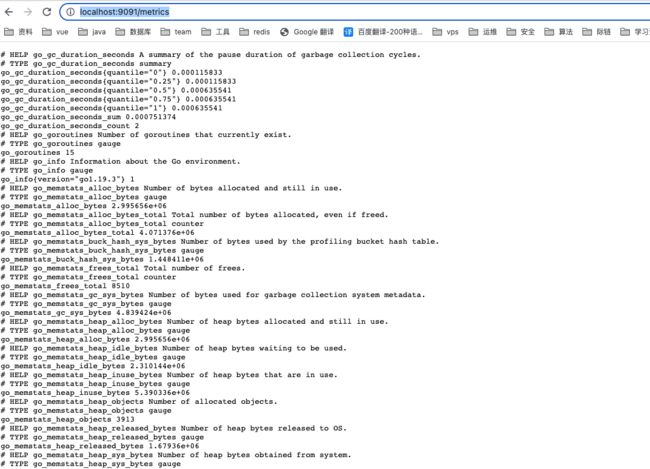
访问http://localhost:9091/metrics查看是否启动成功,可以看到Pushgateway自身也带了一些指标
边缘服务器配置
下载node-exporter
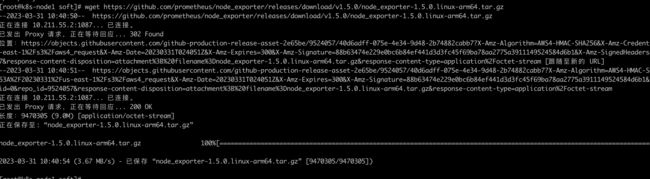
wget https://github.com/prometheus/node_exporter/releases/download/v1.5.0/node_exporter-1.5.0.linux-arm64.tar.gz
下载完成以后执行tar -xvf node_exporter-1.5.0.linux-arm64.tar.gz && cd node_exporter-1.5.0.linux-arm64进行解压

解压完成以后,执行./node_exporter进行简单验证,
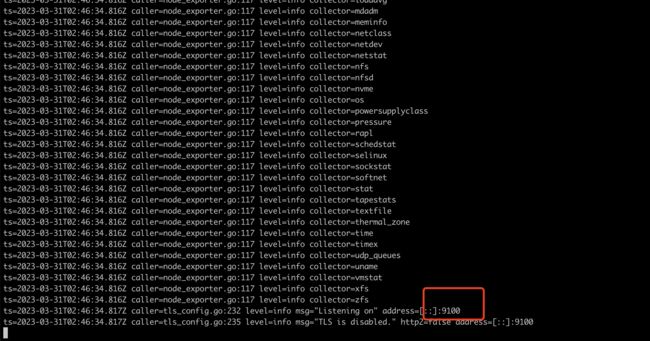
看到以上信息则启动成功,通过浏览器进行访问http://ip:9100/metrics,可以看到以下指标
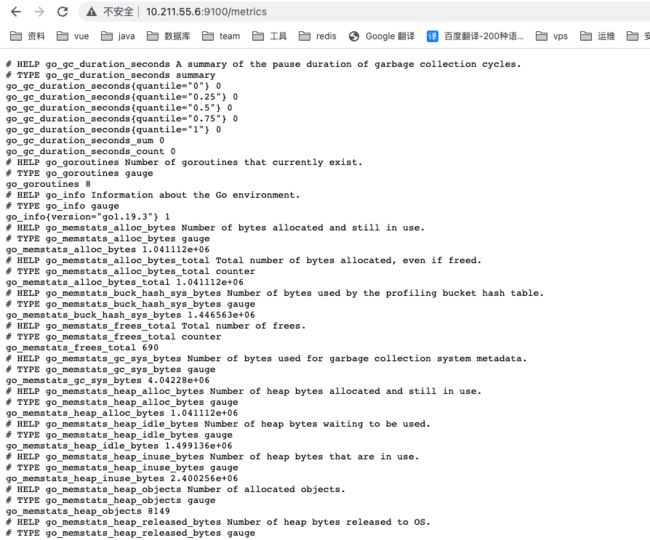
安装node-exporter
由于直接启动node-exporter关闭窗口此进程就会挂掉,因此可以采用systemctl方式进行配置
- 执行
mv node_exporter //usr/local/移动node_exporter文件 - 在
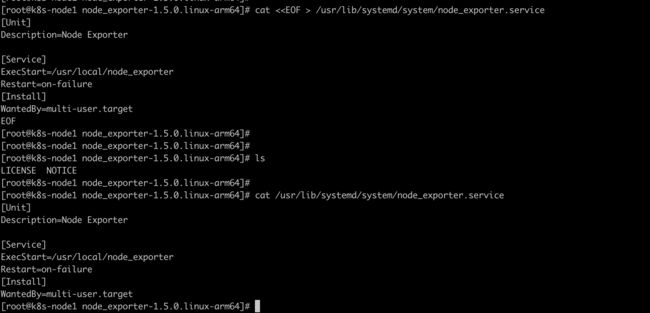
/usr/lib/systemd/system/目录,创建node_exporter.service文件,内容如下,ExecStart指向的就是node_exporter执行文件
cat <<EOF > /usr/lib/systemd/system/node_exporter.service
[Unit]
Description=Node Exporter

[Service]
ExecStart=/usr/local/node_exporter
Restart=on-failure
[Install]
WantedBy=multi-user.target
EOF
- 执行
systemctl daemon-reload - 执行
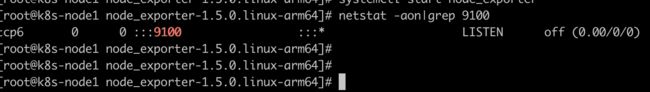
systemctl start node_exporter启动node_exporter - 执行
netstat -aon|grep 9100查看9100是否启动成功
边缘端指标上报
由于node-exporter只提供的数据,默认是由prometheus进行pull的方式来获取指标数据,而我们需要主动push数据到Pushgateway,所以这里需要增加shell脚本,先获取node-exporter数据,然后在调用Pushgateway接口进行push,以下为推送语句
- PushgatewayIP: 10.211.55.2
- 边缘服务器IP:10.211.55.6
curl 10.211.55.6:9100/metrics|curl --data-binary @- http://10.211.55.2:9091/metrics/job/agent-server/instance/10.211.55.6/hostname/边缘服务器
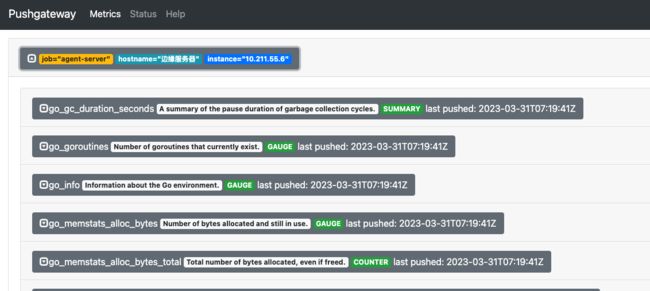
手动执行以下脚本,并访问Pushgateway查看是否有对应数据
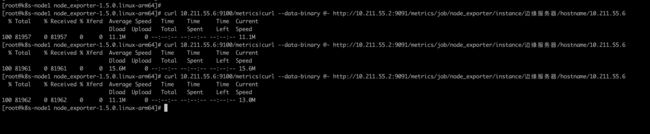
可以看到数据已上传
虽然以上脚本没问题,但是还需要定时执行才行,所以需要编写shell脚本,并通过crontab进行调用
创建shell脚本
cat <<EOF > /etc/cron.d/propushgateway.sh
#!/bin/bash
curl 10.211.55.6:9100/metrics|curl --data-binary @- http://10.211.55.2:9091/metrics/job/agent-server/instance/hostname/10.211.55.6
date>> /tmp/date.txt
EOF
分配文件执行权限
chmod 777 /etc/cron.d/propushgateway.sh
配置crontab任务,10s执行一次,由于crontab只支持到分,所以采用采用以下方式配置
crontab -e

* * * * * /etc/cron.d/propushgateway.sh
* * * * * sleep 10; /etc/cron.d/propushgateway.sh
* * * * * sleep 20; /etc/cron.d/propushgateway.sh
* * * * * sleep 30; /etc/cron.d/propushgateway.sh
* * * * * sleep 40; /etc/cron.d/propushgateway.sh
* * * * * sleep 50; /etc/cron.d/propushgateway.sh
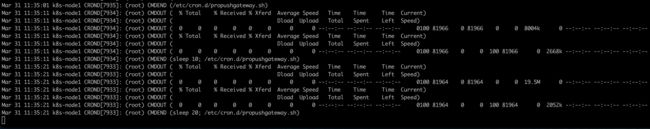
查看执行日志tail -f /var/log/cron,可以看到10s执行一次
修改prometheus配置文件
在prometheus.yml文件中增加如下配置
  - job_name: 'AgentServer'
    # Override the global default and scrape targets from this job every 5 seconds.
    honor_labels: false
    static_configs:
      - targets: ['10.211.55.2:9091']
        labels:
          pushgateway_instance: agent-server  ##这里必须加这边标签过滤,不然采集的是pushGateway数据
增加完成以后重启prometheus
docker restart prometheus
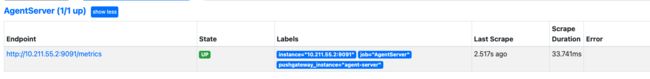
启动完成以后访问prometheus地址,查看Pushgateway的target已经生效
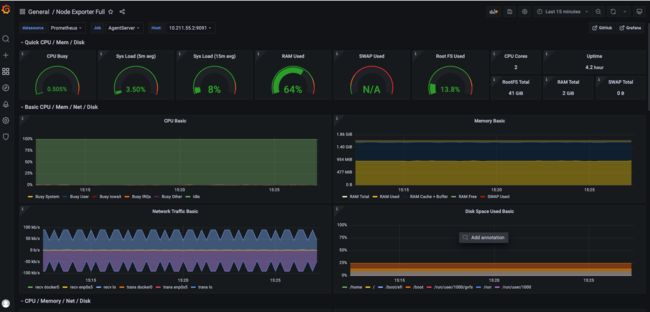
通过Grafana查看数据