vue-echarts echarts组件 更好的在vue项目中使用
vue-echarts
使用github上封装过的组件
github地址 https://github.com/ecomfe/vue-echarts
中文文档
npm & ESM
$ npm install echarts vue-echarts
要在 Vue 2 下使用 vue-echarts,需要确保 @vue/composition-api 已经安装:
npm i -D @vue/composition-api
mins文件夹里面进行配置
全局配置
import Vue from 'vue'
import App from './App2.vue'
import router from './router'
import store from './store'
import ECharts from 'vue-echarts'
import 'echarts'
// import { use } from 'echarts/core'
Vue.config.productionTip = false
// 全局注册组件(也可以使用局部注册)
Vue.component('v-chart', ECharts)
new Vue({
  router,
  store,
  render: h => h(App)
}).$mount('#app')
单独使用 参考
import Vue from 'vue'
import ECharts from 'vue-echarts'
import { use } from 'echarts/core'
// 手动引入 ECharts 各模块来减小打包体积

import {
  CanvasRenderer
} from 'echarts/renderers'
import {
  BarChart
} from 'echarts/charts'
import {
  GridComponent,
  TooltipComponent
} from 'echarts/components'

use([
  CanvasRenderer,
  BarChart,
  GridComponent,
  TooltipComponent
]);

// 全局注册组件(也可以使用局部注册)
Vue.component('v-chart', ECharts)

new Vue(...)
为了更小的打包体积,我们建议手动从 ECharts 引入单个图表和组件。请参考所有支持的渲染器/图表/组件。前往 →
但如果你实在需要全量引入 ECharts 从而无需手动引入模块,只需要在代码中添加:
import "echarts";
实现动态echarts图标
每秒图标动态切换一次
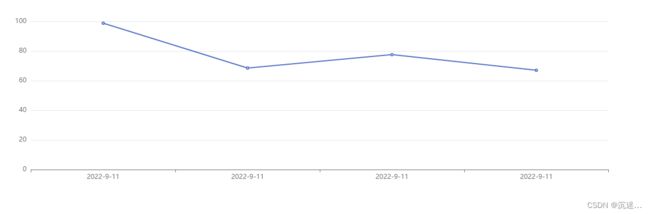
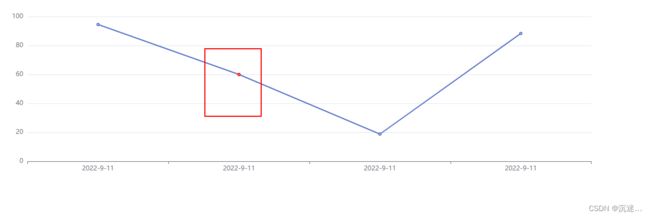
异常点标记
<template>
  <v-chart class="chart" :option="option" />
</template>

<script>
export default {
  name: 'HelloWorld',
  data() {
    return {
      data: this.getRandomData()
    }
  },
  computed: {
    option() {
      return {
        xAxis: {
          type: 'category',
          data: this.data.map(item => item.time)
        },
        yAxis: {
          type: 'value'
        },
        series: [
          {
            data: this.data.map(item => {
              if (item.hasError) {
                return {
                  value: item.value,
                  itemStyle: {
                    color: 'red'
                  }
                }
              }
              return item.value
            }),
            type: 'line'
          }
        ]
      }
    }
  },
  methods: {
    getRandomData() {
      return [
        {
          time: '2022-9-11',
          value: Math.random() * 100,
          hasError: false
        },
        {
          time: '2022-9-11',
          value: 60,
          hasError: true
        },
        {
          time: '2022-9-11',
          value: Math.random() * 100,
          hasError: false
        },
        {
          time: '2022-9-11',
          value: Math.random() * 100,
          hasError: false
        }
      ]
    }
  },
  created() {
    setInterval(() => {
      this.data = this.getRandomData()
    }, 1000)
  }
}
</script>

<style scoped>
.chart {
  height: 400px;
}
</style>
异常区间标记
DOCTYPE html>
<html lang="en">
<head>
    <meta charset="UTF-8">
    <meta http-equiv="X-UA-Compatible" content="IE=edge">
    <meta name="viewport" content="width=device-width, initial-scale=1.0">
    <title>Documenttitle>
    <style>
        body {
            margin: 0;
        }
        #chart {
            width: 100vw;
            height: 100vh;
        }
    style>
head>
<body>
    <div id="chart">div>
    <script src="./data.js">script>
    <script src="../lib/echarts.min.js">script>
    <script>

        const errorIndexPieces = area
            .map(a => [
                data.findIndex(d => d.date === a.from),
                data.findIndex(d => d.date === a.to),
            ]) // [ [0, 2], [4, 6] ]
            .flat(1); // [0, 2, 4, 6]

        const indexPieces = [0, ...errorIndexPieces, data.length - 1]; // [0, 0, 2, 4, 6, 8]

        const pieces = indexPieces.reduce((prev, current, i) => {
            if (!indexPieces[i + 1]) {
                return prev;
            }
            prev.push({
                gt: current,
                lte: indexPieces[i + 1],
                color: i % 2 === 0 ? 'green' : 'red',
            });
            return prev;
        }, []);

        const chart = echarts.init(document.getElementById('chart'));
        chart.setOption({
            xAxis: {
                type: 'category',
                data: data.map(d => d.date),
            },
            yAxis: {
                type: 'value'
            },
            visualMap: {
                show: false,
                dimension: 0,
                pieces,
            },
            series: [
                {
                    data: data.map(d => d.value),
                    type: 'line'
                }
            ],
        });
    script>
body>
html>
data.js
const data = [
    {
        date: '2016-05-01',
        value: 123,
    },
    {
        date: '2016-05-02',
        value: 232,
    },
    {
        date: '2016-05-03',
        value: 232,
    },
    {
        date: '2016-05-04',
        value: 501,
    },
    {
        date: '2016-05-05',
        value: 331,
    },
    {
        date: '2016-05-06',
        value: 271,
    },
    {
        date: '2016-05-07',
        value: 512,
    },
    {
        date: '2016-05-08',
        value: 561,
    },
];

const area = [
    {
        from: '2016-05-01',
        to: '2016-05-03',
    },
    {
        from: '2016-05-05',
        to: '2016-05-07',
    },
];
图标缩放 见仓库
demo地址
https://gitee.com/ye-xingchen/vue-echarts-demo/tree/master/echarts
https://blog.csdn.net/qq_41999617/article/details/114080012 博客内容