日常学习之:使用均值来填补缺失值的条件
文章目录
- 均值填补
-
- 如何判断正态分布
-
- 可视化观察
- 卡方检验
- 结论
均值填补
- 很多时候,我们的数据会存在缺失值的情况,如果数据量大的情况下我们通常会选择将缺失的数据删除,但是如果数据量比较小,我们则需要对缺失值进行填补
- 均值填补的方式是一种常用的方式,那么均值填补需要具备的条件是什么呢?
- 缺失值的数量不能超过总数据的 1/10;如果缺失的数量过大,均值就会失准从而均值填补失效
- 数据要满足正态分布才能用均值进行填补
如何判断正态分布
可视化观察
import pandas as pd
from scipy import stats
import numpy as np
import matplotlib.pyplot as plt
import seaborn as sns
file = r'./iris-clean.csv'
df = pd.read_csv(file,sep=',',header=0)
df
| sepal.length | sepal.width | petal.length | petal.width | variety | |
|---|---|---|---|---|---|
| 0 | 5.1 | 3.5 | 1.4 | 0.2 | Setosa |
| 1 | 4.9 | 3.0 | 1.4 | 0.2 | Setosa |
| 2 | 4.7 | 3.2 | 1.3 | 0.2 | Setosa |
| 3 | 4.6 | 3.1 | 1.5 | 0.2 | Setosa |
| 4 | 5.0 | 3.6 | 1.4 | 0.2 | Setosa |
| ... | ... | ... | ... | ... | ... |
| 145 | 6.7 | 3.0 | 5.2 | 2.3 | Virginica |
| 146 | 6.3 | 2.5 | 5.0 | 1.9 | Virginica |
| 147 | 6.5 | 3.0 | 5.2 | 2.0 | Virginica |
| 148 | 6.2 | 3.4 | 5.4 | 2.3 | Virginica |
| 149 | 5.9 | 3.0 | 5.1 | 1.8 | Virginica |
150 rows × 5 columns
sepal_len = df['sepal.length']
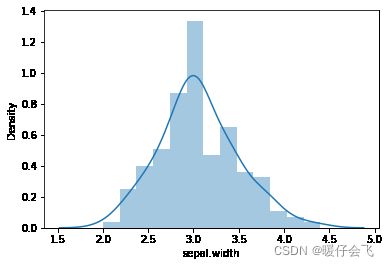
sepal_width = df['sepal.width']
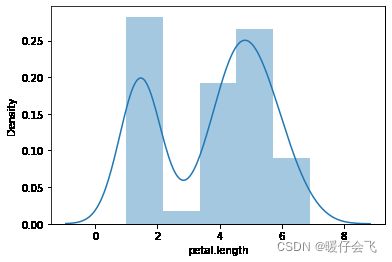
petal_len = df['petal.length']
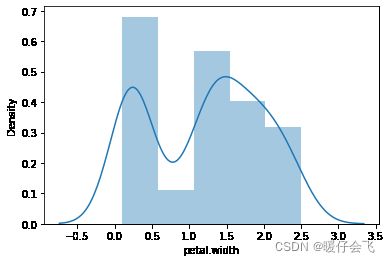
petal_width = df['petal.width']
sns.distplot(sepal_len)

sns.distplot(sepal_width)
sns.distplot(petal_len)
sns.distplot(petal_width)
卡方检验
sepal_len = np.array(sepal_len)
stats.kstest(sepal_len,'norm',(sepal_len.mean(),sepal_len.std()))  # 卡方检验 pvalue > 0.05 就是正态分布
KstestResult(statistic=0.08945440179507252, pvalue=0.1706852358415618)
sepal_width = np.array(sepal_width)
stats.kstest(sepal_width,'norm',(sepal_width.mean(),sepal_width.std()))  #  所以这是正态分布
KstestResult(statistic=0.10583307189330171, pvalue=0.0644929989865557)
petal_len = np.array(petal_len)
stats.kstest(petal_len,'norm',(petal_len.mean(),petal_len.std()))  # 所以这不是正态分布
KstestResult(statistic=0.19894200836859716, pvalue=1.1160726642867047e-05)
petal_width = np.array(petal_width)
stats.kstest(petal_width,'norm',(petal_width.mean(),petal_width.std()))  # 所以这不是正态分布
KstestResult(statistic=0.1736414962992952, pvalue=0.0002000375783506314)
结论
- 从这个例子来看,只有前两组数据可以通过均值来填补缺失值