压测mysql数据库_sysbench 压测mysql数据库
sysbench是一款压力测试工具,可以测试系统的硬件性能,也可以用来对数据库进行基准测试,使用起来很方便,
同时sysbench支持以下几种测试模式:
1、CPU运算性能
2、磁盘IO性能
3、调度程序性能
4、内存分配及传输速度
5、POSIX线程性能
6、数据库性能(OLTP基准测试)
目前sysbench主要支持 mysql,drizzle,pgsql,oracle 等几种数据库。
1.
安装sysbench:
yum install epel-release
yum install sysbench -y
使用sysbench --help 查看帮助。
2.sysbench提供了很多自带压测脚本,脚本放在 /usr/share/sysbench 目录下,本文使用安装sysbench压测mysql数据库:
在准备压测的数据库上创建用户和数据库信息:
grant all privileges on *.* to sysbench identified by 'sysbench';
flush privileges;
create database sysbench_db;
a.准备压测数据:
sysbench /usr/share/sysbench/oltp_insert.lua \
--mysql-host=192.168.56.102 \
--mysql-port=3306 \
--mysql-user=sysbench \
--mysql-password='sysbench' \
--mysql-db=sysbench_db \
--db-driver=mysql \
--tables=15 \
--table-size=500000 \
--report-interval=10 \
--threads=128 \
--time=120 \
prepare
[root@my-mm sysbench]# sysbench /usr/share/sysbench/oltp_insert.lua \
> --mysql-host=192.168.56.102 \
> --mysql-port=3306 \
> --mysql-user=sysbench \
> --mysql-password='sysbench' \
> --mysql-db=sysbench_db \
> --db-driver=mysql \
> --tables=15 \
> --table-size=500000 \
> --report-interval=10 \
> --threads=128 \
> --time=120 \
> prepare
sysbench 1.0.9 (using system LuaJIT 2.0.4)
Initializing worker threads...
Creating table 'sbtest14'...
Creating table 'sbtest12'...
Creating table 'sbtest3'...
Creating table 'sbtest5'...
Creating table 'sbtest11'...
Creating table 'sbtest4'...
Creating table 'sbtest13'...
Creating table 'sbtest10'...
Creating table 'sbtest9'...
Creating table 'sbtest8'...
Creating table 'sbtest15'...
Creating table 'sbtest1'...
Creating table 'sbtest2'...
Creating table 'sbtest6'...
Creating table 'sbtest7'...
Inserting 500000 records into 'sbtest12'
Inserting 500000 records into 'sbtest11'
Inserting 500000 records into 'sbtest10'
Inserting 500000 records into 'sbtest2'
Inserting 500000 records into 'sbtest5'
Inserting 500000 records into 'sbtest8'
Inserting 500000 records into 'sbtest13'
Inserting 500000 records into 'sbtest4'
Inserting 500000 records into 'sbtest3'
Inserting 500000 records into 'sbtest7'
Inserting 500000 records into 'sbtest15'
Inserting 500000 records into 'sbtest1'
Inserting 500000 records into 'sbtest6'
Inserting 500000 records into 'sbtest9'
Inserting 500000 records into 'sbtest14'
Creating a secondary index on 'sbtest9'...
Creating a secondary index on 'sbtest11'...
Creating a secondary index on 'sbtest1'...
Creating a secondary index on 'sbtest5'...
Creating a secondary index on 'sbtest14'...
Creating a secondary index on 'sbtest6'...
Creating a secondary index on 'sbtest13'...
Creating a secondary index on 'sbtest4'...
Creating a secondary index on 'sbtest15'...
Creating a secondary index on 'sbtest8'...
Creating a secondary index on 'sbtest2'...
Creating a secondary index on 'sbtest7'...
Creating a secondary index on 'sbtest12'...
Creating a secondary index on 'sbtest3'...
Creating a secondary index on 'sbtest10'...
查看监控:

b.压测:
sysbench /usr/share/sysbench/oltp_insert.lua \
--mysql-host=192.168.56.102 \
--mysql-port=3306 \
--mysql-user=sysbench \
--mysql-password='sysbench' \
--mysql-db=sysbench_db \
--db-driver=mysql \
--tables=15 \
--table-size=500000 \
--report-interval=10 \
--threads=128 \
--time=120 \
run
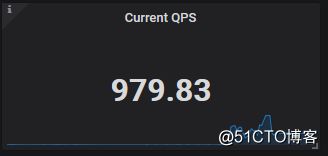
查看qps:
[root@my-mm sysbench]# sysbench /usr/share/sysbench/oltp_insert.lua \
> --mysql-host=192.168.56.102 \
> --mysql-port=3306 \
> --mysql-user=sysbench \
> --mysql-password='sysbench' \
> --mysql-db=sysbench_db \
> --db-driver=mysql \
> --tables=15 \
> --table-size=500000 \
> --report-interval=10 \
> --threads=128 \
> --time=120 \
> run
sysbench 1.0.9 (using system LuaJIT 2.0.4)
Running the test with following options:
Number of threads: 128
Report intermediate results every 10 second(s)
Initializing random number generator from current time
Initializing worker threads...
Threads started!
[ 10s ] thds: 128 tps: 1475.71 qps: 1475.71 (r/w/o: 0.00/1475.71/0.00) lat (ms,95%): 164.45 err/s: 0.00 reconn/s: 0.00
[ 20s ] thds: 128 tps: 895.50 qps: 895.50 (r/w/o: 0.00/895.50/0.00) lat (ms,95%): 282.25 err/s: 0.00 reconn/s: 0.00
[ 30s ] thds: 128 tps: 1490.81 qps: 1490.81 (r/w/o: 0.00/1490.81/0.00) lat (ms,95%): 189.93 err/s: 0.00 reconn/s: 0.00
[ 40s ] thds: 128 tps: 1385.42 qps: 1385.42 (r/w/o: 0.00/1385.42/0.00) lat (ms,95%): 207.82 err/s: 0.00 reconn/s: 0.00
[ 50s ] thds: 128 tps: 1300.72 qps: 1300.72 (r/w/o: 0.00/1300.72/0.00) lat (ms,95%): 193.38 err/s: 0.00 reconn/s: 0.00
[ 60s ] thds: 128 tps: 2194.74 qps: 2194.74 (r/w/o: 0.00/2194.74/0.00) lat (ms,95%): 92.42 err/s: 0.00 reconn/s: 0.00
[ 70s ] thds: 128 tps: 2226.52 qps: 2226.52 (r/w/o: 0.00/2226.52/0.00) lat (ms,95%): 86.00 err/s: 0.00 reconn/s: 0.00
[ 80s ] thds: 128 tps: 1149.59 qps: 1149.59 (r/w/o: 0.00/1149.59/0.00) lat (ms,95%): 272.27 err/s: 0.00 reconn/s: 0.00
[ 90s ] thds: 128 tps: 881.20 qps: 881.20 (r/w/o: 0.00/881.20/0.00) lat (ms,95%): 320.17 err/s: 0.00 reconn/s: 0.00
[ 100s ] thds: 128 tps: 1602.52 qps: 1602.52 (r/w/o: 0.00/1602.52/0.00) lat (ms,95%): 142.39 err/s: 0.00 reconn/s: 0.00
[ 110s ] thds: 128 tps: 1722.31 qps: 1722.31 (r/w/o: 0.00/1722.31/0.00) lat (ms,95%): 158.63 err/s: 0.00 reconn/s: 0.00
[ 120s ] thds: 128 tps: 1956.95 qps: 1956.95 (r/w/o: 0.00/1956.95/0.00) lat (ms,95%): 108.68 err/s: 0.00 reconn/s: 0.00
SQL statistics:
queries performed:
read: 0
write: 182948
other: 0
total: 182948
transactions: 182948 (1522.89 per sec.)
queries: 182948 (1522.89 per sec.)
ignored errors: 0 (0.00 per sec.)
reconnects: 0 (0.00 per sec.)
General statistics:
total time: 120.1302s
total number of events: 182948
Latency (ms):
min: 3.65
avg: 84.00
max: 3444.05
95th percentile: 189.93
sum: 15367235.04
Threads fairness:
events (avg/stddev): 1429.2812/12.53
execution time (avg/stddev): 120.0565/0.03
c.清理压测数据:
sysbench /usr/share/sysbench/oltp_insert.lua \
--mysql-host=192.168.56.102 \
--mysql-port=3306 \
--mysql-user=sysbench \
--mysql-password='sysbench' \
--mysql-db=sysbench_db \
--db-driver=mysql \
--tables=15 \
--table-size=500000 \
--report-interval=10 \
--threads=128 \
--time=120 \
cleanup
[root@my-mm sysbench]# sysbench /usr/share/sysbench/oltp_insert.lua \
> --mysql-host=192.168.56.102 \
> --mysql-port=3306 \
> --mysql-user=sysbench \
> --mysql-password='sysbench' \
> --mysql-db=sysbench_db \
> --db-driver=mysql \
> --tables=15 \
> --table-size=500000 \
> --report-interval=10 \
> --threads=128 \
> --time=120 \
> cleanup
sysbench 1.0.9 (using system LuaJIT 2.0.4)
Dropping table 'sbtest1'...
Dropping table 'sbtest2'...
Dropping table 'sbtest3'...
Dropping table 'sbtest4'...
Dropping table 'sbtest5'...
Dropping table 'sbtest6'...
Dropping table 'sbtest7'...
Dropping table 'sbtest8'...
Dropping table 'sbtest9'...
Dropping table 'sbtest10'...
Dropping table 'sbtest11'...
Dropping table 'sbtest12'...
Dropping table 'sbtest13'...
Dropping table 'sbtest14'...
Dropping table 'sbtest15'...