SpringMVC+highstock实现曲线报表
最近项目要做曲线报表,之前用的是生成图片然后传到前端,感觉不是很好,在网上找到资料说highstock就可以而且还可以做类似股票的那种实时的曲线,研究的一段时间把项目问题解决了做个总结:
首先把highstock.js放到项目资源路径下,因为这个需要JQuery,所以jquery-1.7.2.min.js也需要放,而且在页面引用是要先引用jquery-1.7.2.min.js再引用highstock.js,刚开始做的时候没注意页面加载完后不出图。我做的这个图还需要exporting.js,所以也要放进项目资源文件夹中
页面代码:
<script type="text/javascript"	src="${pageContext.request.contextPath}/js/jquery-1.7.2.min.js"></script>

	<script type="text/javascript"	src="${pageContext.request.contextPath}/js/highstock.js"></script>

	<script type="text/javascript"	src="${pageContext.request.contextPath}/js/exporting.js"></script>

		<script >

		$(document).ready(function(){

		$("#sub").click(function(){

			var names = [];

			$("input:checked[name=sms]").each(function(i, e) {

				var ks = $(this).val();

					if(ks == 1) {

					names.push(1, 2);

					}

					else if (ks == 2){

					names.push(3, 4, 5, 6, 7, 8);

					}

					else if (ks == 3){

					names.push(9, 10, 11, 12, 13);

					}

					else if (ks == 4){

					names.push(14, 15, 16, 17, 18, 19, 20);

					}

					else if (ks == 5){

					names.push(21, 22, 23, 24, 25, 26, 27);

					}

					else if (ks == 6){

					names.push(28, 29, 30, 31, 32, 33, 34, 35);

					}

					else if (ks == 7){

					names.push(36, 37, 38, 39, 40, 41);

					}

			});

			var seriesOptions = [],

    		yAxisOptions = [],

    		seriesCounter = 0,

    		colors = Highcharts.getOptions().colors;

			$.each(names, function(i, name) {

				//后台读取json数据

		        $.getJSON("<%=request.getContextPath()%>/JSONByAction?name="+name+"toh="+2, function(data) {

		            //将json数据放入seriesOptions数组

		            seriesOptions[i] = {

		                    name: name,

		                    data: data

		                };

		            seriesCounter++;

		            if (seriesCounter == names.length) {

		                 //开始绘图

		                createChart();

		            }

				});

				function createChart() {

        window.chart = new Highcharts.StockChart({

            chart : {

                renderTo : 'container'

            },

            rangeSelector : {

                selected : 4

            },

            title : {

                text : '湿度显示'

            },

            credits : {

            enabled : false//去掉右下角的标志

        	},

        	 rangeSelector: {

                        // 缩放选择按钮,是一个数组。

                        // 其中type可以是: 'millisecond', 'second', 'minute', 'day', 'week', 'month', 'ytd' (year to date), 'year' 和 'all'。

                        // 其中count是指多少个单位type。

                        // 其中text是配置显示在按钮上的文字

                        buttons: [{

                                type: 'month',

                                count: 1,

                                text: '1月'

                            }, {

                                type: 'month',

                                count: 3,

                                text: '3月'

                            }, {

                                type: 'month',

                                count: 6,

                                text: '6月'

                            }, {

                                type: 'year',

                                count: 1,

                                text: '1年'

                            },{

                                type: 'year',

                                count: 3,

                                text: '3年'

                            }, {

                                type: 'all',

                                text: '所有'

                            }],

                        // 默认选择域:0(缩放按钮中的第一个)、1(缩放按钮中的第二个)……

                        selected: 1,

                        // 是否允许input标签选框

                        inputEnabled: false

                    },

            //右上角日期区间格式化

            rangeSelector:{

                selected:1,

                inputDateFormat:'%Y-%m-%d'

            },

            xAxis: {

                type: 'datetime',

                //x轴时间的格式化

                dateTimeLabelFormats: {

                    second: '%Y-%m-%d<br/>%H:%M:%S',

                    minute: '%Y-%m-%d<br/>%H:%M',

                    hour: '%Y-%m-%d<br/>%H:%M',

                    day: '%Y<br/>%m-%d',

                    week: '%Y<br/>%m-%d',

                    month: '%Y-%m',

                    year: '%Y'

                }

            },

            yAxis : {

                title : {

                    text : '湿度'

                },

                labels: {

		    		formatter: function() {

		    			return (this.value > 0 ? '+' : '') + this.value + '%';

		    		}

		    	}

            },

            //弹出框的格式化显示

            tooltip: {

                xDateFormat: '%Y-%m-%d %A',

                pointFormat: '<span style="color:{series.color}">{point.name}</span>: <b>{point.y}</b><br/>',

                    valueDecimals:2

            },

            series :seriesOptions

        });

    }

			});

		});

	});

</script>

<div id="container" style="height: 500px; min-width: 600px"></div>
后台其实就简单了,
@SuppressWarnings("rawtypes")

	@RequestMapping("/queHumHistory")

	@ResponseBody

	public Map kan(HttpServletRequest request,HttpServletResponse response){

int id = Integer.parseInt(request.getParameter("region"));

		List<TempHumHistory> historyList = historyImpl.queHistoryById(id);

		 Map<String, Object> modelMap = new HashMap<String, Object>(3);

		   modelMap.put("total", "1");

		   modelMap.put("data", historyList);

		   modelMap.put("success", "true");

		   return modelMap;


	}
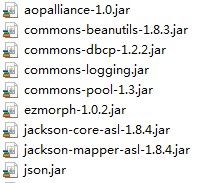
要引入的包: 