Qt图表曲线上ToopTip效果实现
基于Qt官方callout实现并做了一些优化;
GraphicsView控件要提升为QChartView或者自定义ChartView chartview.h(实现鼠标缩放、右键恢复等功能)

callout.h
/****************************************************************************
**
** Copyright (C) 2016 The Qt Company Ltd.
** Contact: https://www.qt.io/licensing/
**
** This file is part of the Qt Charts module of the Qt Toolkit.
**
** $QT_BEGIN_LICENSE:GPL$
** Commercial License Usage
** Licensees holding valid commercial Qt licenses may use this file in
** accordance with the commercial license agreement provided with the
** Software or, alternatively, in accordance with the terms contained in
** a written agreement between you and The Qt Company. For licensing terms
** and conditions see https://www.qt.io/terms-conditions. For further
** information use the contact form at https://www.qt.io/contact-us.
**
** GNU General Public License Usage
** Alternatively, this file may be used under the terms of the GNU
** General Public License version 3 or (at your option) any later version
** approved by the KDE Free Qt Foundation. The licenses are as published by
** the Free Software Foundation and appearing in the file LICENSE.GPL3
** included in the packaging of this file. Please review the following
** information to ensure the GNU General Public License requirements will
** be met: https://www.gnu.org/licenses/gpl-3.0.html.
**
** $QT_END_LICENSE$
**
****************************************************************************/

#ifndef CALLOUT_H
#define CALLOUT_H

#include
#include
#include

QT_BEGIN_NAMESPACE
class QGraphicsSceneMouseEvent;
QT_END_NAMESPACE

QT_CHARTS_BEGIN_NAMESPACE
class QChart;
QT_CHARTS_END_NAMESPACE

QT_CHARTS_USE_NAMESPACE

class Callout : public QGraphicsItem
{
public:
    Callout(QChart *parent);
    void setText(const QString &text);
    void setAnchor(QPointF point);
    void updateGeometry();

    QRectF boundingRect() const;
    void paint(QPainter *painter, const QStyleOptionGraphicsItem *option,QWidget *widget);

protected:
    void mousePressEvent(QGraphicsSceneMouseEvent *event);
    void mouseMoveEvent(QGraphicsSceneMouseEvent *event);

private:
    QString m_text;
    QRectF m_textRect;
    QRectF m_rect;
    QPointF m_anchor;
    QFont m_font;
    QChart *m_chart;
};

#endif // CALLOUT_H
callout.cpp
设置字体和文字居中显示;
/****************************************************************************
**
** Copyright (C) 2016 The Qt Company Ltd.
** Contact: https://www.qt.io/licensing/
**
** This file is part of the Qt Charts module of the Qt Toolkit.
**
** $QT_BEGIN_LICENSE:GPL$
** Commercial License Usage
** Licensees holding valid commercial Qt licenses may use this file in
** accordance with the commercial license agreement provided with the
** Software or, alternatively, in accordance with the terms contained in
** a written agreement between you and The Qt Company. For licensing terms
** and conditions see https://www.qt.io/terms-conditions. For further
** information use the contact form at https://www.qt.io/contact-us.
**
** GNU General Public License Usage
** Alternatively, this file may be used under the terms of the GNU
** General Public License version 3 or (at your option) any later version
** approved by the KDE Free Qt Foundation. The licenses are as published by
** the Free Software Foundation and appearing in the file LICENSE.GPL3
** included in the packaging of this file. Please review the following
** information to ensure the GNU General Public License requirements will
** be met: https://www.gnu.org/licenses/gpl-3.0.html.
**
** $QT_END_LICENSE$
**
****************************************************************************/

#include "callout.h"
#include
#include
#include
#include
#include
Callout::Callout(QChart *chart):
    QGraphicsItem(chart),
    m_chart(chart)
{
}
QRectF Callout::boundingRect() const
{
    QPointF anchor = mapFromParent(m_chart->mapToPosition(m_anchor));
    QRectF rect;
    rect.setLeft(qMin(m_rect.left(), anchor.x()));
    rect.setRight(qMax(m_rect.right(), anchor.x()));
    rect.setTop(qMin(m_rect.top(), anchor.y()));
    rect.setBottom(qMax(m_rect.bottom(), anchor.y()));
    return rect;
}

void Callout::paint(QPainter *painter, const QStyleOptionGraphicsItem *option, QWidget *widget)
{
    Q_UNUSED(option)
    Q_UNUSED(widget)
    QPainterPath path;
    path.addRoundedRect(m_rect, 5, 5);

    QPointF anchor = mapFromParent(m_chart->mapToPosition(m_anchor));
    if (!m_rect.contains(anchor)) {
        QPointF point1, point2;

        // establish the position of the anchor point in relation to m_rect
        bool above = anchor.y() <= m_rect.top();
        bool aboveCenter = anchor.y() > m_rect.top() && anchor.y() <= m_rect.center().y();
        bool belowCenter = anchor.y() > m_rect.center().y() && anchor.y() <= m_rect.bottom();
        bool below = anchor.y() > m_rect.bottom();

        bool onLeft = anchor.x() <= m_rect.left();
        bool leftOfCenter = anchor.x() > m_rect.left() && anchor.x() <= m_rect.center().x();
        bool rightOfCenter = anchor.x() > m_rect.center().x() && anchor.x() <= m_rect.right();
        bool onRight = anchor.x() > m_rect.right();

        // get the nearest m_rect corner.
        qreal x = (onRight + rightOfCenter) * m_rect.width();
        qreal y = (below + belowCenter) * m_rect.height();
        bool cornerCase = (above && onLeft) || (above && onRight) || (below && onLeft) || (below && onRight);
        bool vertical = qAbs(anchor.x() - x) > qAbs(anchor.y() - y);

        qreal x1 = x + leftOfCenter * 10 - rightOfCenter * 20 + cornerCase * !vertical * (onLeft * 10 - onRight * 20);
        qreal y1 = y + aboveCenter * 10 - belowCenter * 20 + cornerCase * vertical * (above * 10 - below * 20);;
        point1.setX(x1);
        point1.setY(y1);

        qreal x2 = x + leftOfCenter * 20 - rightOfCenter * 10 + cornerCase * !vertical * (onLeft * 20 - onRight * 10);;
        qreal y2 = y + aboveCenter * 20 - belowCenter * 10 + cornerCase * vertical * (above * 20 - below * 10);;
        point2.setX(x2);
        point2.setY(y2);

        path.moveTo(point1);
        path.lineTo(anchor);
        path.lineTo(point2);
        path = path.simplified();
    }
    painter->setBrush(QColor(255, 255, 255));
    painter->drawPath(path);
    painter->drawText(m_textRect,Qt::AlignCenter, m_text);
}

void Callout::mousePressEvent(QGraphicsSceneMouseEvent *event)
{
    event->setAccepted(true);
}

void Callout::mouseMoveEvent(QGraphicsSceneMouseEvent *event)
{
    if (event->buttons() & Qt::LeftButton){
        setPos(mapToParent(event->pos() - event->buttonDownPos(Qt::LeftButton)));
        event->setAccepted(true);
    } else {
        event->setAccepted(false);
    }
}

void Callout::setText(const QString &text)
{
    m_text = text;
    m_font = QFont("SimHei",12);
    QFontMetrics metrics(m_font);
    m_textRect = metrics.boundingRect(QRect(0, 0, 120, 120), Qt::AlignLeft, m_text);
    m_textRect.translate(5, 5);
    prepareGeometryChange();
    m_rect = m_textRect.adjusted(-5, -5, 5, 5);
}

void Callout::setAnchor(QPointF point)
{
    m_anchor = point;
}

void Callout::updateGeometry()
{
    prepareGeometryChange();
    setPos(m_chart->mapToPosition(m_anchor) + QPoint(10, -50));
}
mainwindow.h
#ifndef MAINWINDOW_H
#define MAINWINDOW_H

#include

#include
#include
#include
#include
#include
#include
#include

QT_BEGIN_NAMESPACE
class QModbusClient;
namespace Ui {
class MainWindow;
}

QT_END_NAMESPACE

class Callout;

class MainWindow : public QMainWindow
{
    Q_OBJECT

public:
    explicit MainWindow(QWidget *parent = nullptr);
    ~MainWindow();
    void setAdmin();
    void setUserName(QString usr);
private:
    Ui::MainWindow *ui;

    QChart * chart;
    QLineSeries * series;

    QDateTimeAxis *axisX;
    QValueAxis *axisY;
    const QString DateTimeFormat = "yyyy-MM-dd HH:mm:ss";

    QList> monitorList;//FrameNo, TierNo, Addr
    QList> moduleList;//moduleID

    QList addrList;//address list 便于查询对应数据并更新
    QMap> map;//架号和Vector绑定 记录在monitorList中的索引
    QVBoxLayout *vlayout, *vlayout2;
    QVector tableVec,tableVec2;
    QVector modelVec,modelVec2;

    Callout *m_tooltip;

    //menu
    QMenu * tableviewMenu;
    QAction * showLine;

    void initTableView();

private slots:
    void showModuleLine();
    void Menu_Slot(QPoint p);
};

#endif // MAINWINDOW_H
mainwindow.cpp
#include "mainwindow.h"

#include
#include

#include
#include
#include
#include
#include
#include
#include
#include

#include
#include "callout.h"

#include

#include
#include

QT_CHARTS_USE_NAMESPACE


#include "ui_mainwindow.h"
MainWindow::MainWindow(QWidget *parent) :
    QMainWindow(parent),
    ui(new Ui::MainWindow),
    vlayout(nullptr),
    vlayout2(nullptr),
    m_tooltip(nullptr)
{
    ui->setupUi(this);


    tableviewMenu = new QMenu();
    showLine = new QAction("显示曲线");
    tableviewMenu->addAction(showLine);
    connect(showLine,SIGNAL(triggered()),this,SLOT(showModuleLine()));
}
void MainWindow::updateChart()
{
    //检查当前tableview数据是否有效
    QModelIndex i = ui->tableView->currentIndex();
    QString module;
    if(i.isValid())
    {
        int row = i.row();
        module = ui->tableView->model()->data(ui->tableView->model()->index(row,1),Qt::DisplayRole).toString();
        if(module == "") return;
    }
    else
        return;
    //从数据库取得所有数据
    QList line = m_order->getDataPoints(module);
    if(line.size() <= 0) return;
    chart->removeAllSeries();
    axisX->setRange(QDateTime::fromMSecsSinceEpoch(line.front().x()),QDateTime::fromMSecsSinceEpoch(line.back().x()));

    series = new QLineSeries();
    series->append(line);
    series->setName("1");//曲线添加名称
    chart->addSeries(series);
    series->attachAxis(axisY);
    series->attachAxis(axisX);
    connect(series, &QLineSeries::hovered, this, &MainWindow::tooltip);
    ui->graphicsView->setChart(chart);
    chart->zoom(0.9999);
    chart->setFocus();
    chart->setTitle(tr("历史数据-")+module);
    qDebug() <<  "show module records success!";
    statusBar()->showMessage(tr("显示模块数据成功!"), 5000);
}
void MainWindow::initChart()
{
   chart = new QChart();
   axisX=new QDateTimeAxis();
   axisX->setRange(QDateTime::currentDateTime(),QDateTime::currentDateTime().addSecs(updateInterval*5));
   axisX->setFormat(DateTimeFormat);
   axisX->setTitleText(tr("时间 s"));
   axisX->setTickCount(5);
   chart->addAxis(axisX,Qt::AlignBottom);

   axisY=new QValueAxis();
   axisY->setMin(0);
   axisY->setMax(13);
   axisY->setTickCount(14);
   axisY->setTitleText(tr("电压值 V"));
   chart->addAxis(axisY,Qt::AlignLeft);

   chart->legend()->hide();
   chart->setTitle(tr("历史数据"));

   ui->graphicsView->setChart(chart);
   ui->graphicsView->setRenderHint(QPainter::Antialiasing);
   qDebug() << "init Chart success!" << endl;
}
void MainWindow::tooltip(QPointF point, bool state)
{
    if (m_tooltip == nullptr)
        m_tooltip = new Callout(chart);
    if (state) {
        QDateTime dt;
        dt.setMSecsSinceEpoch(point.x());
        m_tooltip->setText(QString("%1\n%2\n%3V").arg(dt.toString("yyyyMMdd")).arg(dt.toString("hh:mm:ss")).arg(double(point.y()),0,'g',5));//
        m_tooltip->setAnchor(point);
        m_tooltip->setZValue(11);
        m_tooltip->updateGeometry();
        m_tooltip->show();
    } else {
        m_tooltip->hide();
    }
}
代码仅供参考。
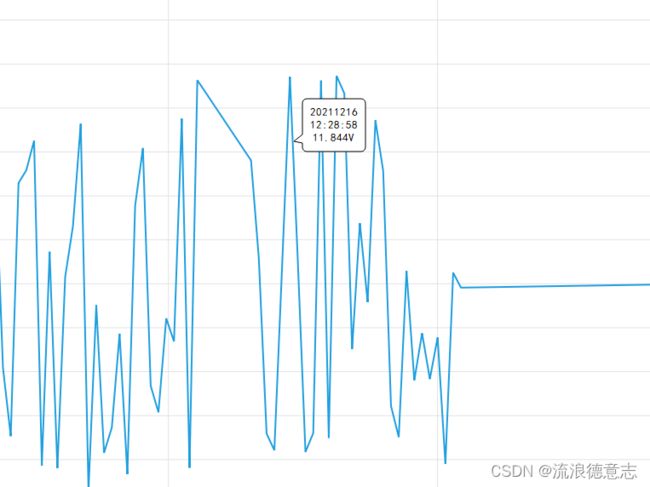
最终效果
显示日期 时间 值