Mschart学习(MSchart介绍)
1.什么是MSChart
- 适用于.NET Framework 3.5 SP1 的ASP.NET和Windows Form图标控制项
- 开发商: 2007年Dundas 开发出收費的Chart控件 2008/9/8微软发布免費的MSChart控件
- Support Service: system :win2003 sp2 ,win2008,windows vista,winxp sp3 .net Framework: .NET Framework 3.5 SP1(VS2008)
- 处理器:400 MHz Pentium(最低);1GHz Pentium(建议) RAM:96 MB(最小)256MB(建议) Hard: 500MB可用磁盘空间
- 显卡: 800*600、256色(小) 1024*768、256色
2.MSchart安装
-
•
1) dotnetfx35setup.exe
2) MSChart.exe
3) MSChart_VisualStudioAddOn.exe
4) MSChartLP_chs.exe
-
安装顺序:
(1)dotnetfx35setup.exe
(2)MSChart_VisualStudioAddOn.exe
(3)MSChartLP_chs.exe
(4)MSChart.exe
(2)MSChart_VisualStudioAddOn.exe
(3)MSChartLP_chs.exe
(4)MSChart.exe
打开VS2008在工具中新增了Data Chart控件:

MSChart 图表类型
1.Bar and Column Charts 3D or 2D Bar or Column Charts like this page:
•
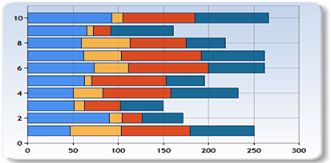

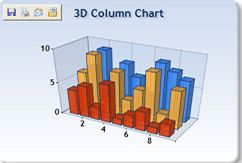
Stacked charts Bar and Column 3D Bar and Column
2.Line Charts

3. Range Charts

4. Circular charts

5. Accumulation charts

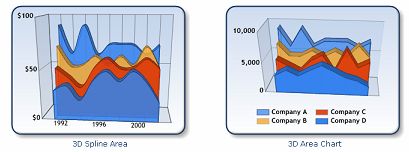
6. Area Chart
7. Pie and Doughnut charts


9. Advanced Financial charts

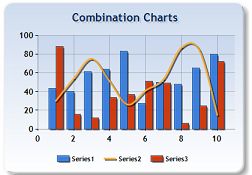
10. Combinational Charts
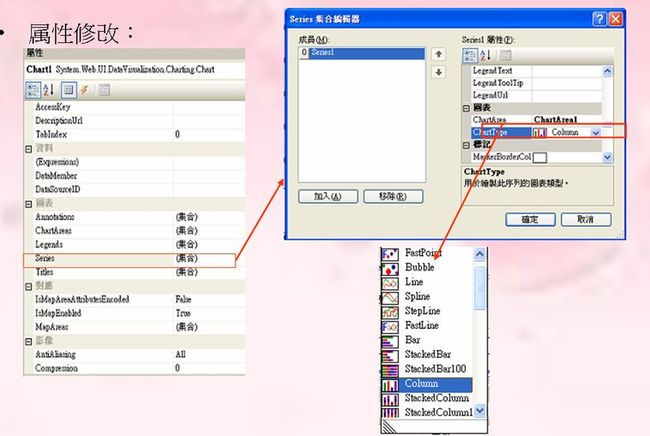
3.MSChart 属性介绍

这些属性在添加chart的时候会有。
开启VS2008 •新建网站ChartTest 打开工具列:
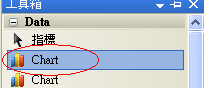
点击Chart在页面中添加Chart图形,在属性栏中选择 Chart类型
4.MSChart inVS2008 实现
•
查询数据结果对应到Chart的XY轴
                          1

                         1

                         )

                         string

                          strSql

                         =


                         "

                         SELECT Top 5 empid, COUNT(*) AS lNum FROM log where empid <> '' GROUP BY empid ORDER BY empid

                         "

                         ;


                          2

                          DataSet ds

                         =

                          SqlHelper.ExecuteDataset(strConnISPD, CommandType.Text, strSql);


                          3

                          DataView dv

                         =


                         new

                          DataView(ds.Tables[

                         0

                         ]);


                          4

                          Chart1.Series[

                         "

                         login

                         "

                         ].Points.DataBindXY(dv,

                         "

                         empid

                         "

                         , dv,

                         "

                         lNum

                         "

                         );


                          5


                         2

                         ) SqlCommand cd

                         =


                         new

                          SqlCommand(strSql, conn);


                          6

                          SqlDataAdapter da

                         =


                         new

                          SqlDataAdapter();


                          7

                          da.SelectCommand

                         =

                          cd;


                          8

                          DataSet ds

                         =


                         new

                          DataSet();


                          9

                          da.Fill(ds,

                         "

                         log

                         "

                         );


                         10

                          DataView dv

                         =


                         new

                          DataView(ds.Tables[

                         0

                         ]);


                         11

                          dv.Sort

                         =

                         "

                         empid

                         "

                         ;


                         12

                          Chart1.Series[

                         "

                         login

                         "

                         ].Points.DataBindXY(dv,

                         "

                         empid

                         "

                         , dv,

                         "

                         lNum

                         "

                         );
使用现有数组数据到Chart的XY轴
                            1

                            double

                            [] yValues

                            =

                             {

                            12

                            ,

                            67

                            ,

                            45

                            ,

                            double

                            .NaN,

                            67

                            ,

                            89

                            ,

                            35

                            ,

                            12

                            ,

                            78

                            ,

                            54

                            };


                            2


                            double

                            [] xValues

                            =

                             {

                            1990

                            ,

                            1991

                            ,

                            1992

                            ,

                            1993

                            ,

                            1994

                            ,

                            1995

                            ,

                            1996

                            ,

                            1997

                            ,

                            1998

                            ,

                            1999

                            };


                            3

                            Chart1.Series[

                            "

                            Series1

                            "

                            ].Points.DataBindXY(xValues, yValues);