让我们一起写一个前端监控系统吧!
CSDN话题挑战赛第2期
参赛话题:前端技术分享
项目介绍

-
我们基于Vue2.利用vue-plugin实现项目级别的npm包监控报错,并专为Vue项目设计了监控中台
-
核心监控插件开箱即用,用户可灵活选择全面应用或组件级别应用,可扩展性强。
-
同时我们暴露了生命周期钩子,用户可自由拓展插件,提高了定制化水平
项目源码
-
被监控网站代码
-
显示中台代码
-
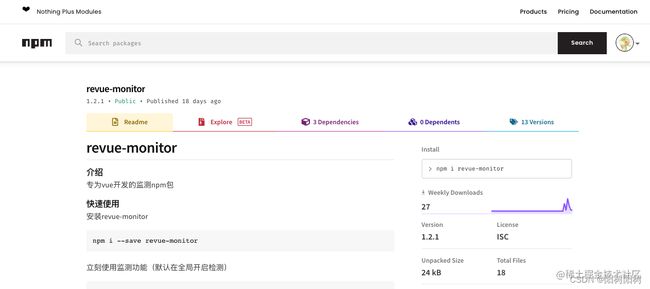
npm包地址
-
展示地址
『技术选型』& 『架构设计』
针对团队内大部分同学的技术栈为vue框架,前端顺水推舟选择了vue2,并使用vue-cli脚手架搭建了被监测网站和监控中台网站的前端项目。
SDK包的开发选择使用了npm包对监控工具打包和使用,符合当前vue + node的开发方案。
后台方面,由于团队后台比较薄弱,我们选择使用serverless函数计算作为基础架构,并使用serverlessDevs作为本地管理工具对koa应用(衍生出的应用级函数计算框架)进行本地远程同步。同时使用阿里云列表存储作为数据库数据存储和处理。由于秉承着轻后端的开发理念,尽量使用了无需担忧服务器部分配置的框架进行开发。FC函数计算和列表存储都具有按量付费,动态伸缩的特性,由云厂商进行服务器管理和安全防护,让团队内成员更加专注于业务开发而非框架设计和维护。
后端因安全因素无法开源出来。
『项目背景』:
如果你是一位前端工程师,那你一定不止一次去解决一些顽固的线上问题,你也曾想方设法复现用户的bug,结果可能都不太理想。 怎样定位前端线上问题,一直以来,都是很头疼的问题,因为它发生于用户的一系列操作之后。错误的原因可能源于机型,网络环境,复杂的操作行为等等,在我们想要去解决的时候很难复现出来,自然也就无法解决,由此我们开发了这个前端监控系统!
『项目结构』
前端方面由于需要体现出监测功能和特性,选择将项目分为三部分,分别进行开发:
-
被监测网站
-
监测工具SDK
-
监测中台网站
1. 被监测网站
我们设计了4个场景值,分别对不同的错误进行监听和处理:
- 被监测网站主要由如下四个部分组成
- 淘宝首页:监测页面渲染的性能和白屏等问题

- 实时聊天:监测ws的链接稳定性和报错
- 表单按钮:监测各类同异步脚本报错
- 在线博客:监测http错误(包括fetch和XHR)

2. 显示中台
- 概述
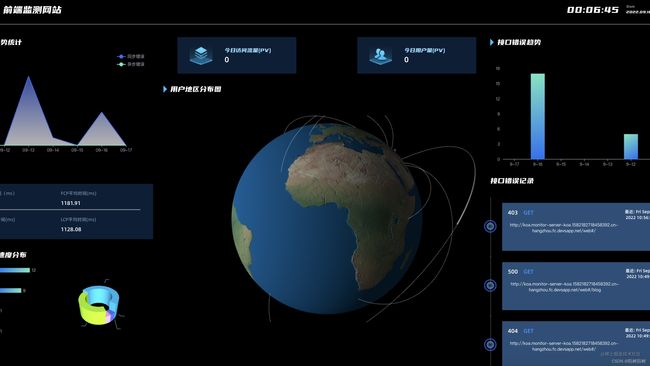
我们采用了大屏+详情页面展示的传统监控中台框架,力求把错误信息和错误趋势,PV,UV等数据更加直观有效率的展示给使用者。框架方面,我们选用了echarts和echarts-gl进行可视化处,并且利用echarts-gl的诸多功能,做出了3D效果来更加直观的显示ip位置信息。同时在UI同学的加持下,我们确保页面的风格清爽,直观,同时充满科技感。各个页面风格统一,数据显示更加人性化。一些常用的组件方面,我么采用了成熟的组件库对中台官网的某些通用但较为复杂的组件进行设计(例如时间选择器)。在保证开发效率的同时,把更多的开发精力专注在页面可视化和人性化交互。
- 中台首页:监控页面各项错误概览。

- 中台JSError部分:被监控页面中JSError的具体报错。

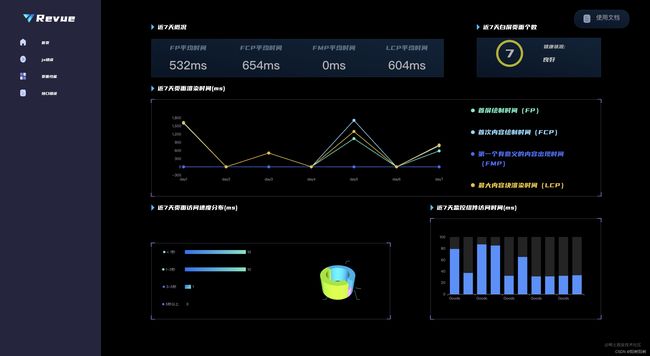
- 中台页面性能部分:FCP、FP、FMP、LCP等显示

- 中台接口错误部分:接口错误概览。

3. 监测工具SDK
我们结合当下主流监测系统的特点,观察到所有的监控框架几乎都是不区分开发框架的。这导致了对不同开发框架的适配性都不是很强。
- 例如webfunny的监控工具只能停留于当前页面的监控,并不能深入到vue框架的某个组件,也无法对vue等框架特殊的生命周期机制做出监听。
同时在拓展方面,几乎所有的主流框架关于用户自身进行工具拓展的能力都比较弱,或者甚至不支持用户自行拓展监控工具,进行闭源收费处理。
针对框架不友好和拓展不友好两个方面,我们选择使用vue提供的插件机制,为vue单独定制一款解决上述问题的监测工具SDK。
-
首先我们使用浏览器或vue框架的各种特性(例如属性,mixin,路由,指令,全局变量等),力求支持监控到vue框架的每个组件和每个生命周期,让使用者彻底掌控vue的项目的每一处监控。
-
其次,我们会逐渐完善并开放出主要监控环节的生命周期HOOKS,使得个体开发者可以友好的扩展和优化监测工具SDK,个性化监控环境。
总结
本章介绍了前端监控系统的技术架构,让大家详细的了解了我们是如何搭建这样的一个企业级前端监控项目,希望能够给大家带来一些启发与帮助。
上一期中我们讲了前端系统中前端的基本架构,大家想必对我们的项目有了深入的了解,本篇文章中,我们将详细介绍被监控网站,有啥值得监控,以及由此 npm 包如何书写。
由上一章的介绍我们可以知道,被监控网站分为四个部分,分别是
淘宝首页、实时聊天、表单按钮、在线博客.
在开始讲解之前,我先把 npm 包的链接放上来
- ==> npm包
淘宝首页
- 此页面主要负责监控
- 组件加载时间
- 加载白屏时间、
- FCP(First Contentful Paint) : 首次绘制任何文本,图像,非空白canvas或SVG的时间点.
- LCP(Largest Contentful Paint) : 可视区域“内容”最大的可见元素开始出现在页面上的时间点。
那么话不多说,让我们顺序来看一下这些页面是如何被监控的!
npm 插件mixin,监控组件加载时间。
此组件并非无脑使用,我们设置了一个开关
this.$options.computeTime,如果您想要使用,在组件中打开开关即可「即设置为true」,实现了组件化的粒度细分
import http from '../utils/request'

let mixin = {

    beforeCreate() {
        // 我们在这里添加了一个属性
        let shouldcompute = this.$options.computeTime
        // 如果用户设置了这个属性,那么就可以启用mixin,获得加载时间。
        if (!shouldcompute) return
        // 获取创建之初的时间
        this.createTime = new Date().getTime()

    },

    mounted() {

        let shouldcompute = this.$options.computeTime

        if (!shouldcompute) return
        // 获取挂载完成的时间
        this.endTime = new Date().getTime()
        // 得到加载时间
        let mountTime = this.endTime - this.createTime
        // 获取所有的节点
        let componentNameArr = this.$vnode.tag.split('-')
        // 从而获取当前节点
        let componentName = componentNameArr[componentNameArr.length - 1]
        // 将得到的数据发送给后台
        http.post('plugin/mount', {

            kind: 'experience',

            type: 'ComponentMountTime',
            // 组件名称
            componentName,
            // 组件加载时间
            mountTime,
            // 发送当前时间
            timeStamp: Date.now(),

        })

    },
}
// 将mixin封装起来
export default {

    install(Vue, options) {

        const oldRevue = Vue.prototype.$revue

        Vue.prototype.$revue = Object.assign({}, oldRevue, {

        compnentMount: mixin

    })

    // Vue.mixin(mixin)

    },
    immediate: {

        install(Vue, options) {

            Vue.mixin(mixin)

        },

    },

    m: mixin

}
我们特意设置了 immediate这个属性,你可以通过如下方法在main.js中进行调用。
Vue.use(revue.immediate)
npm插件 判断是否白屏
import onload from '../utils/onload'
import http from '../utils/request'

let blankScreen = () => {
  let wrapperElements = ['html', 'body', '#app']
  let emptyPoints = 0
  //
  function getSelector(element) {
    if (element.id) {
      return '#' + element.id
    } else if (element.className) {
      // a b c => .a.b.c
      return (
        '.' +
        element.className
          .split(' ')
          .filter((item) => !!item)
          .join('.')
      )
    } else {
      return element.nodeName.toLowerCase()
    }
  }
  function isWrapper(element) {
    let selector = getSelector(element)
    if (wrapperElements.indexOf(selector) !== -1) {
      emptyPoints++
    }
  }
  // 使用 elementsFromPoint 与 isWrapper 来判断是否白屏
  onload(function () {
    for (let i = 1; i <= 9; i++) {
      let xElements = document.elementsFromPoint(
        (window.innerWidth * i) / 10,
        window.innerHeight / 2
      )
      let yElements = document.elementsFromPoint(
        window.innerWidth / 2,
        (window.innerHeight * i) / 10
      )
      isWrapper(xElements[0])
      isWrapper(yElements[0])
    }

    if (emptyPoints >= 18) {
      let centerElements = document.elementsFromPoint(
        window.innerWidth / 2,
        window.innerHeight / 2
      )

      http.post('/plugin/blank', {
        kind: 'stability',
        type: 'blank',
        emptyPoints,
        screen: window.screen.width + 'X' + window.screen.height,
        viewPoint: window.innerWidth + 'X' + window.innerHeight,
        timeStamp: Date.now(),
        selector: getSelector(centerElements[0]),
      })
    }
  })
}

export default {
  install(Vue, options) {
    const oldRevue = Vue.prototype.$revue
    Vue.prototype.$revue = Object.assign({}, oldRevue, {
      blankScreen
    })
  },
  immediate: {
    install(Vue, options) {
      blankScreen()
      const oldRevue = Vue.prototype.$revue
      Vue.prototype.$revue = Object.assign({}, oldRevue, {
        blankScreen
      })
    },
  },
  b: blankScreen
}
判断是否是白屏的思路是:我们对页面上的9个点分横纵进行判断是否有元素,如果18次判断全部都没有检索到元素,我们就需要向后端发送数据,让它知道这个页面发生白屏了!
npm插件,获取性能数据
import onload from '../utils/onload'
import http from '../utils/request'

let timing = () => {
  let FMP, LCP
  // 加一个 if 是因为有时候这玩意是 undefined
  if (PerformanceObserver) {
    // 增加一个性能条目的观察者
    new PerformanceObserver((entryList, observer) => {
      let perfEntries = entryList.getEntries()
      FMP = perfEntries[0] //startTime 2000以后
      observer.disconnect() //不再观察了
    }).observe({ entryTypes: ['element'] }) //观察页面中的意义的元素

    new PerformanceObserver((entryList, observer) => {
      let perfEntries = entryList.getEntries()
      LCP = perfEntries[0]
      observer.disconnect() //不再观察了
    }).observe({ entryTypes: ['largest-contentful-paint'] }) //观察页面中的意义的元素
  }

  //用户的第一次交互 点击页面
  onload(function () {
    setTimeout(() => {
      const { fetchStart, loadEventStart } = performance.timing
      // 此处直接使用 API 了
      let FP = performance.getEntriesByName('first-paint')[0]
      let FCP = performance.getEntriesByName('first-contentful-paint')[0]
      let loadTime = loadEventStart - fetchStart
      //开始发送性能指标
      //console.log('FP', FP)
      //console.log('FCP', FCP)
      //console.log('FMP', FMP)
      //console.log('LCP', LCP)
      http.post('/plugin/paint', {
        kind: 'experience', //用户体验指标
        type: 'paint', //统计每个阶段的时间
        firstPaint: FP.startTime,
        firstContentfulPaint: FCP.startTime,
        firstMeaningfulPaint: FMP?.startTime || -1,
        largestContentfulPaint: LCP?.startTime || -1,
        timeStamp: Date.now(),
      })
      http.post('/plugin/load', {
        kind: 'experience', //用户体验指标
        type: 'load', //统计每个阶段的时间
        loadTime,
        timeStamp: Date.now(),
      })
    }, 3000)
  })
}

export default {
  install(Vue, options) {
    const oldRevue = Vue.prototype.$revue
    Vue.prototype.$revue = Object.assign({}, oldRevue, {
      timing
    })
  },
  immediate: {
    install(Vue, options) {
      timing(Vue, options)
      const oldRevue = Vue.prototype.$revue
      Vue.prototype.$revue = Object.assign({}, oldRevue, {
        timing
      })
    },
  },
  t: timing
}
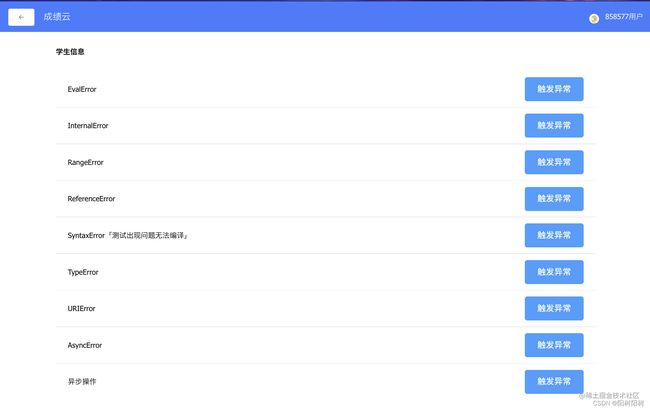
表单页面
表单按钮 => 『监控错误内容』
- 表单按钮这里的逻辑主要是对常见的JS错误进行汇总,然后收集起来,发送到后端。
EvalError错误
// html
<button @click="EvalError">
// js代码
/*
 * 如果此处非法使用 eval(),则抛出 EvalError 异常
 * 根据 ES9
 * 此异常不再会被JavaScript抛出,但是EvalError对象仍然保持兼容性
**/
EvalError() {
  return eval( '(' + obj + ')' )
}
复制代码
InternalError错误
// html
<button @click="InternalError">
// js代码
/**
 * 该错误在JS引擎内部发生,特别是当它有太多数据要处理并且堆栈增长超过其关键限制时。
*/
InternalError() {
    function foo() {
        foo()
    }
    foo()
}
复制代码
RangeError错误
// html
<button @click="RangeError">
// js
// 当数字超出允许的值范围时,将抛出此错误
RangeError() {
    const arr = [99, 88]
    arr.length = 99 ** 99
}
复制代码
ReferenceError错误
// html
<button @click="ReferenceError">
// js
// 当出现非法引用的时候报错
ReferenceError() {
    foo.substring(1);
}
复制代码
URIError错误
// html
<button @click="URIError">
// js
/**
* 用 encodeURI 等编码含有不合法字符的字符串,导致编解码失败
* 编码操作会将每一个字符实例替换为一到四个相对应的UTF-8编码形式的转义序列。
* 如果试图一个非高-低位完整的代理自负,将会抛出一个URIError错误
*/
URIError() {
    let a = encodeURI('\uD800%')
    console.log(a)
}
复制代码
TypeError错误
- 此处访问到了
undefined
// html
<button @click="TypeError">
// js代码
TypeError() {
    window.someVar.error = 'error'
}
复制代码
AsyncError错误 |Promise错误
// html
<button @click="Async">
// js代码
AsyncError() {
    Promise.reject('this is an error message');
}
复制代码
npm 封装 「我们如何获取错误信息?」
概述:JSError有同步错误也有异步错误,window.onerror既可以捕获同步错误也可以捕获异步错误,在Vue中有一个API叫Vue.config.errorHandler,会截取同步错误,window.onerror自然就接收被筛选出来的异步错误了,但是这个时候我们发现Promise错误并没有被window.onerror捕获到,所以我们还需要unhandledrejection来捕获这个错误,至此,所有的错误就捕获完毕了。
我们在写入我们自己的方法之前,不能直接覆盖,需要确认用户是否使用过我们使用的方法,如果没有使用过,那么我们就可以直接使用,如果使用过,那我们就调用一下
call方法
const oldErrorHandler = Vue.config.errorHandler
Vue.config.errorHandler = (error, vm, info) => {
  if(oldErrorHandler) oldErrorHandler.call(this, error, vm, info)
}
我们需要使用一个包「
StackTracey」把错误处理一下,处理成我们好处理的样子
import StackTracey from 'stacktracey'
const stack = new StackTracey(error)
使用
Vue.config.errorHandler来捕获同步错误
    Vue.config.errorHandler = (error, vm, info) => {
      if (oldErrorHandler) oldErrorHandler.call(this, err, vm, info)
      const stack = new StackTracey(error)
      const log = {
        kind: "stability",
        errorType: "jsError",   //jsError
        simpleUrl: window.location.href.split('?')[0].replace('#', ''),   // 页面的url
        timeStamp: new Date().getTime(),   // 日志发生时间
        position: `${stack.items[0].column}:${stack.items[0].line}`,  // 需要处理掉无效的前缀信息
        fileName: stack.items[0].fileName,  //错误文件名
        message: stack.items[0].callee,  //错误信息
        detail: `${error.toString()}`,
        isYibu: 'false',  //是否是异步
      }
      console.error(error)
      axios.post('/plugin/postErrorMessage', log)
    }
使用
window.onerror来捕获异步错误
    window.addEventListener("error", function (event) {
      // console.log(event)
      let log = {
        kind: "stability", //稳定性指标
        errorType: "jsError", //jsError
        simpleUrl: window.location.href.split('?')[0].replace('#', ''), // 页面的url
        timeStamp: new Date().getTime(), // 日志发生时间
        position: (event.lineno || 0) + ":" + (event.colno || 0), //行列号
        fileName: event.filename, //报错链接
        message: event.message, //报错信息
        detail: "null",
        isYibu: "ture"
      };
      axios.post('/plugin/postErrorMessage', log)
    },
      true
    ); // true代表在捕获阶段调用,false代表在冒泡阶段捕获,使用true或false都可以
使用
unhandledrejection来捕获Promise错误
    window.addEventListener("unhandledrejection", function (event) {
      // console.log(event)
      let log = {
        kind: "stability", //稳定性指标
        errorType: "jsError", //jsError
        simpleUrl: window.location.href.split('?')[0].replace('#', ''), // 页面的url
        timeStamp: new Date().getTime(), // 日志发生时间
        message: event.reason, //报错信息
        fileName: "null", //报错链接
        position: (event.lineno || 0) + ":" + (event.colno || 0), //行列号
        detail: "null",
        isYibu: "ture"
      };
      axios.post('/plugin/postErrorMessage', log)
    },
      true
    ); // true代表在捕获阶段调用,false代表在冒泡阶段捕获,使用true或false都可以
博客页面「HTTP Error 页面」
主要功能: 上报页面请求报错信息
实现:
通过修改原型链的形式实现对原ajax请求、fetch请求的封装和增强,捕获并向后台发送错误数据。
以下是对监控Ajax错误的实现,我们对浏览器内置的XMLHttpRequest的open和send方法进行保存,并通过修改原型链的形式对以上两个方法进行重写和增强,正是通过这种方法我们既没有影响被监控页面原本请求业务的实现,又完成了我们捕获请求错误的目的。
let XMLHttpRequest = window.XMLHttpRequest;
  let oldOpen = XMLHttpRequest.prototype.open; //缓存老的open方法   XMLHttpRequest.prototype.open = function (method, url, async) {
    //重写open方法     if (!url.match(/plugin/)) {
      //防止死循环       this.logData = { method, url, async }; //增强功能,把初始化数据保存为对象的属性     }
    return oldOpen.apply(this, arguments);
  };

  let oldSend = XMLHttpRequest.prototype.send; //缓存老的send方法   XMLHttpRequest.prototype.send = function (body) {
    //重写sned方法     if (this.logData) {
      //如果有值,说明已经被拦截了       // ......
      let handler = (type) => (e) => {         let data = {
          //...把我们想要的数据给记录下来
        };
        tracker.postHTTP(data);
      };
      this.addEventListener("load", handler("load"), false); //传输完成,所有数据保存在 response 中       this.addEventListener("error", handler("error"), false); //500也算load,只有当请求发送不成功时才是error       this.addEventListener("abort", handler("abort"), false); //放弃     }
    return oldSend.apply(this, arguments);
  };
以下是捕获fetch请求错误的实现,其实是基于类似的思路
if (!window.fetch) return;
  let oldFetch = window.fetch;
  window.fetch = function (url, obj = { method: "GET", body: "" }) {
    //......
    return oldFetch
      .apply(this, arguments)
      .then((response) => {
        if (!response?.ok) {
          console.log("test", response);
          // True if status is HTTP 2xx           if (!url.match(/plugin/)) {
            tracker.postHTTP({
              //这里写入我们想向后台发送的错误数据
            });
          }
        }
      })
      .catch((error) => {
        // 上报错误         console.error("I am error", error);
        tracker.postHTTP({
          //这里写入我们想向后台发送的错误数据
        });
        // throw error;       });
  };
websocketError部分
监听 websocket 错误 通过保留原型链方法再扩展的形式实现对websocket监听,捕获到错误向后台发送错误数据。
const monitor = () => {
/*    */
  WebSocket.prototype.oldsend = WebSocket.prototype.send;
  WebSocket.prototype.send = function (data) {
    // 记得开始时间
    WebSocket.prototype.startTime = new Date();
    // 调用原方法
    WebSocket.prototype.oldsend.call(this, data);
  };
  WebSocket.prototype.oldclose = WebSocket.prototype.close;
  WebSocket.prototype.close = function (err) {
        /* 错误逻辑发送数据 */
      WebSocket.prototype.oldclose.call(this);
    }
  };
  //  WebSocket.prototype...
};
- 项目源码
- 被监控网站代码
- 显示中台代码
- npm包地址
- 展示地址
序言
在前面两篇文章中,我们不仅了解了此前端监控的技术架构以及页面效果,还对完成“监控”这个核心功能的 npm 包有了深入的理解。
在封装完错误监控,获取错误数据之后,让我们走进可视化屏幕的世界!
没错,本章节将介绍我们中台可视化大屏的构建过程,其中主要使用到了 Echarts。
那么话不多说,和我一起来看看吧!
Echarts 大屏一览
首页

页面性能
JS错误概况
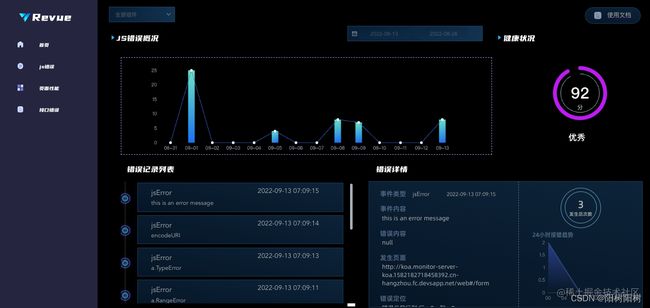
接口错误
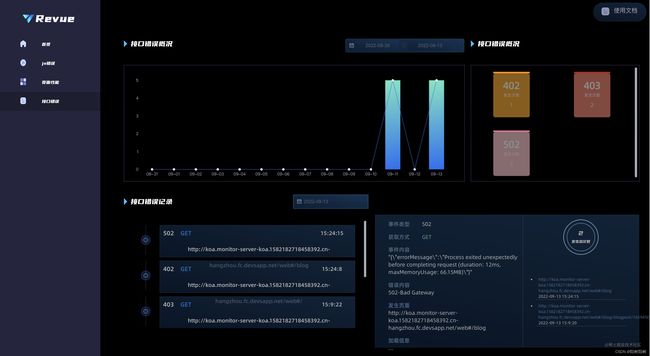
看完了 Echarts 做出的效果之后,你有没有迫不及待的想要上手试一试呢?
让我们仔细的聊聊 Echarts~
Tips: 我会把某一个功能的代码分析完之后全部贴上去,大家如果需要可以直接取用看效果嗷!
关于echarts
安装
- 下载
npm i echarts
- 在
main.js中导入echarts并注册别名
import * as echarts from 'echarts'
Vue.prototype.$echarts = echarts
使用
开发流程是在官网上找和自己需求相近的图然后对一些部分进行更改以满足自己的需求。
在下面我会给我的源代码以及几个主要用来更改图片效果的部分,不会列全,主要是常用,如果想要仔细的去看可以从这里看官方的文档Echarts
1. JS报错折线图

相关配置
- 首先我设置的是
dark模式,所以需要在初始化的时候单独操作
这样设置的原因是可以和
UI整体的设计风格适配。
const myChart = this.$echarts.init(chartDom, 'dark')
- 图片的标题可以通过
option下的title来设置,字体也可以进行设置,诺~
title: {
	text: 'JS报错趋势统计',
	textStyle: {
	fontFamily: "Alibaba",
	   fontSize: 18,
	   color: "#fff",
	}
},
但是我这里并没有使用
title因为我这里还有需求,字体前面需要用到图片,所以我就单独写了个组件解决这个问题。
- 背景颜色可以通过
backgroundColor来设置
backgroundColor: '#000000',
- 如果你想要设置
hover出现相对应的特效,你可以加一个tooltip
tooltip: {
	trigger: 'axis',
	axisPointer: {
		type: 'shadow'
	}
},
xAxis|yAxis一般模版图里都有,这里就不赘述了。- 值得一题的是我这个折线图从上到下有一个渐变颜色,是怎么设置的呢?
areaStyle: {
	color: {
	type: 'linear',
	x: 0,
	y: 0,
	x2: 0,
	y2: 1,
	 colorStops: [
	 // 渐变颜色
	  {
	     offset: 0,
	     color: '#466AEB'
	  },
	  {
	     offset: 1,
	     color: '#ffff'
	  }
	],
	 global: false
	}
}
在series下面设置一个
areaStyle就可以了
全部代码
// html
<div id="main" style="height: calc((100vw / 7 * 2 - 99px) * 0.67); width: calc(100vw / 7 * 2 - 99px)"></div>
// js
import titleComponentVue from './titleComponent.vue'
export default {
   name: 'firstGraph',
   components: {
       titleComponentVue
  },
   data() {
       return {
           time: ['7-24', '7-25', '7-26', '7-27', '7-28', '7-29', '7-30'] || [],
           jsErrorNumberTong: [12, 120, 430, 430, 450, 320, 120] || [],
           jsErrorNumberYi: [12, 225, 327, 330, 320, 220, 120] || [],
           na: 'JS报错趋势统计'
      }
  },
   mounted() {
       const chartDom = document.getElementById('main')
       const myChart = this.$echarts.init(chartDom, 'dark')
       let option = {
           tooltip: {
               trigger: 'axis',
               axisPointer: {
                   type: 'shadow'
              }
          },
           backgroundColor: '#000000',
           // title: {
           //     text: 'JS报错趋势统计',
           //     textStyle: {
           //         fontFamily: "Alibaba",
           //         fontSize: 18,
           //         color: "#fff",
           //     }
           // },
           legend: {
               orient: 'vertical',
               data: ['同步错误', '异步错误'],
               right: -5,
               top: 15
          },
           xAxis: {
               type: 'category',
               data: this.time, // 时间
               boundaryGap: false
          },
           yAxis: {
               type: 'value',
               splitLine: {
                   show: false
              }
          },
           series: [{
                   name: '同步错误',
                   type: 'line',
                   data: this.jsErrorNumberTong,
                   symbol: 'none',
                   lineStyle: {
                       // 设置线条的style等
                       normal: {
                           color: '#466AEB' // 折线线条颜色:红色
                      }
                  },
                   itemStyle: {
                       // 设置线条上点的颜色(和图例的颜色)
                       normal: {
                           color: '#466AEB'
                      }
                  },
                   areaStyle: {
                       color: {
                           type: 'linear',
                           x: 0,
                           y: 0,
                           x2: 0,
                           y2: 1,
                           colorStops: [
                               // 渐变颜色
                              {
                                   offset: 0,
                                   color: '#466AEB'
                              },
                              {
                                   offset: 1,
                                   color: '#ffff'
                              }
                          ],
                           global: false
                      }
                  }
              },
              {
                   name: '异步错误',
                   type: 'line',
                   symbol: 'none',
                   data: this.jsErrorNumberYi,
                   lineStyle: {
                       // 设置线条的style等
                       normal: {
                           color: '#6BE6C1' // 折线线条颜色:红色
                      }
                  },
                   itemStyle: {
                       // 设置线条上点的颜色(和图例的颜色)
                       normal: {
                           color: '#6BE6C1'
                      }
                  },
                   areaStyle: {
                       color: {
                           type: 'linear',
                           x: 0,
                           y: 0,
                           x2: 0,
                           y2: 1,
                           colorStops: [
                               // 渐变颜色
                              {
                                   offset: 0,
                                   color: '#6BE6C1'
                              },
                              {
                                   offset: 1,
                                   color: '#402D6B'
                              }
                          ],
                           global: false
                      }
                  }
              }
          ]
      };
       myChart.setOption(option)
  }
}
2. 页面访问速度分布

相关配置
- 页面
居中|居左|居右配置
可以使用
grid来对你想要操作的部分进行配置,在option下
grid: {
 left: '10%',
 // right: '30%',
 bottom: '0%',
 containLabel: true
}
boundaryGap属性
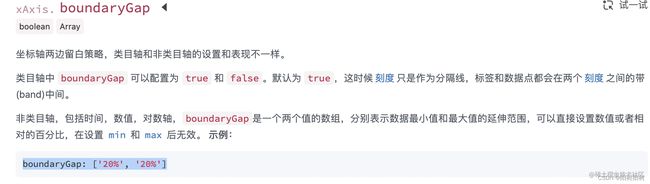
可以用来设置柱子是否在如下坐标下划线中间

在这里被我用来使我的柱状图更加紧凑,这样好看些。
- axisLabel => formatter
想知道前面的
<1s,1-3s以及前面的圆点是怎么来的嘛,这里就需要使用formatter格式来进行约束了。
原图链接
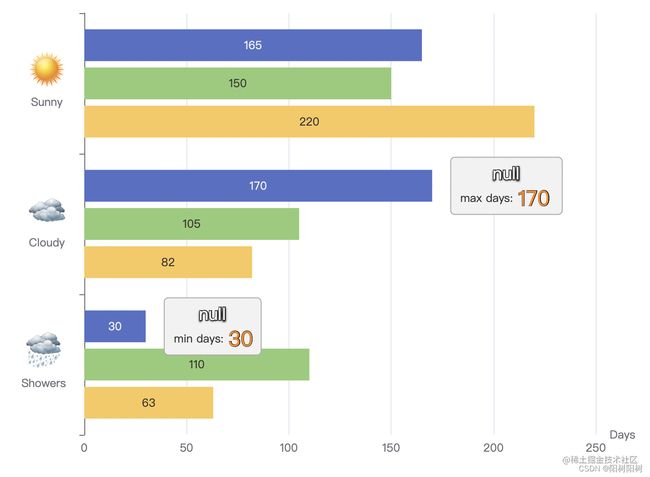
可以对比一下上下两张图,你会发现我做出的改造是
图片 => 原点
文字 => 读秒
先贴一下这部分的代码
data: ['0', '1', '2', '3'],
axisLabel: {
interval: 0,
formatter: function (value) {
 if (parseInt(value) == 0) {
return '{' + value + '| } {value|' + '< 1秒   ' + '}';
} else if (parseInt(value) == 1) {
return '{' + value + '| } {value|' + '1-3秒   ' + '}';
} else if (parseInt(value) == 2) {
return '{' + value + '| } {value|' + '3-5秒 ' + '}';
} else {
   return '{' + value + '| } {value|' + '5秒以上' + '}';
}
},
从data里面拿值,在formatter里面逐个的进行判断,然后写成文字。
- 那么,前面的小圆球怎么出现的呢?
当然是通过rich属性来设置的!
rich: {
value: {
lineHeight: 30,
align: 'center'
},
 0: {
   height: 8,
   width: 8,
   align: 'center',
   backgroundColor: '#8ED6FA ',
   borderRadius: 10
},
 1: {
   height: 8,
   width: 8,
   align: 'center',
   backgroundColor: '#6BE6C1 ',
   borderRadius: 10
  },
  2: {
  height: 8,
  width: 8,
  align: 'center',
  backgroundColor: '#466AEB ',
  borderRadius: 10
  },
  3: {
  height: 8,
  width: 8,
  align: 'center',
  backgroundColor: '#466AEB ',
  borderRadius: 10
  }
}
通过和css类似的写法,完成了小圆球的绘制
- 还有一个很酷的操作,看原图会有y轴,而我的需求图中没有y轴,我试过把y轴去掉,但是这样操作的话,前面的label都会被消除掉。
我的team成员给我出了一个主意,不用删除它,只要我们看不见它就可以了 ———— 线条颜色与背景颜色同色!
在
yAxis下方
axisLine: {
	lineStyle: {
	   color: '#000',
	   width: 1, //这里是为了突出显示加上的
	},
},
完整代码
// html
<div id="main1" style="width: calc((100vw / 7 * 2 - 64px) * 5 / 8 );">div>
// js
export default {
name: 'thirdGraph',
components: {
titleComponent,
fourGraph
},
data() {
return {
na: '页面访问速度分布'
}
},
mounted() {
const chartDom1 = document.getElementById('main1')
const myChart1 = this.$echarts.init(chartDom1, 'dark')
var option1;
const seriesLabel = {
show: true,
position: 'right'
};
option1 = {
grid: {
left: '10%',
// right: '30%',
bottom: '0%',
top: '0%',
containLabel: true
},
backgroundColor: '#000000',
// title: {
// text: '页面访问速度分布',
// textStyle: {
// fontFamily: "Alibaba",
// fontSize: 18,
// color: "#fff",
// }
// },
tooltip: {
trigger: 'axis',
axisPointer: {
type: 'shadow'
}
},
// grid: {
// left: 100
// },
// toolbox: {
// show: true,
// feature: {
// saveAsImage: {}
// }
// },
xAxis: {
type: 'value',
show: false,
axisLabel: {
formatter: '{value}'
},
splitLine: {
show: false
},
color: 'black',
},
yAxis: {
axisLine: {
lineStyle: {
color: '#000',
width: 1, //这里是为了突出显示加上的
},
},
splitLine: {
show: false
},
boundaryGap: true,
type: 'category',
inverse: true,
data: ['0', '1', '2', '3'],
axisLabel: {
interval: 0,
formatter: function (value) {
if (parseInt(value) == 0) {
return '{' + value + '| } {value|' + '< 1秒 ' + '}';
} else if (parseInt(value) == 1) {
return '{' + value + '| } {value|' + '1-3秒 ' + '}';
} else if (parseInt(value) == 2) {
return '{' + value + '| } {value|' + '3-5秒 ' + '}';
} else {
return '{' + value + '| } {value|' + '5秒以上' + '}';
}
},
margin: 20,
rich: {
value: {
lineHeight: 30,
align: 'center'
},
0: {
height: 8,
width: 8,
align: 'center',
backgroundColor: '#8ED6FA ',
borderRadius: 10
},
1: {
height: 8,
width: 8,
align: 'center',
backgroundColor: '#6BE6C1 ',
borderRadius: 10
},
2: {
height: 8,
width: 8,
align: 'center',
backgroundColor: '#466AEB ',
borderRadius: 10
},
3: {
height: 8,
width: 8,
align: 'center',
backgroundColor: '#466AEB ',
borderRadius: 10
}
}
}
},
series: [{
name: 'City Beta',
type: 'bar',
label: seriesLabel,
data: [150, 105, 110, 178],
barWidth: 13,
color: {
type: 'linear',
x: 0,
y: 0,
x2: 1,
y2: 1,
colorStops: [{
offset: 0,
color: '#1A70F3' // 0% 处的颜色
},
{
offset: 1,
color: '#6BE6C1 ' // 100% 处的颜色
}
],
global: false // 缺省为 false
}
// barCategoryGap: '100%',
// boundaryGap: ['10%','10%','10%','20%']
}]
};
myChart1.setOption(option1);
}
}
3. 竖着的柱状图
相关配置

- 通过
option=>xAxis=>axisTick=>alignWithLabel来设置是否去掉向下的钩
alignWithLabel: false
xAxis: [{
	type: 'category',
	data: this.jiekouTime,
	axisTick: {
	alignWithLabel: true
	}
}],
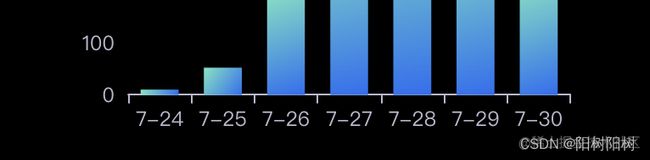
alignWithLabel: true
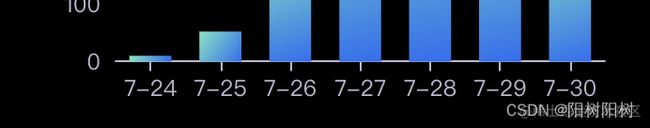
- 通过
option=>yAxis=>splitLine来设置去掉背景分割线
yAxis: [{
	type: 'value',
	splitLine: {
	show: false
	}
}],
完整代码
// html
<div id="main8" style="height: calc((100vw / 7 * 2 - 99px) * 0.67); width: calc(100vw / 7 * 2 - 99px)"></div>
// js
export default {
components: { titleComponent },
name: 'eightGraph',
comments: {
titleComponent
},
data() {
return {
jiekouTime: ['7-24', '7-25', '7-26', '7-27', '7-28', '7-29', '7-30']|| [],
jiekouErrorNumber: [10, 52, 200, 334, 390, 330, 220] || [],
na: '接口错误趋势',
}
},
mounted() {
var chartDom4 = document.getElementById('main8');
var myChart4 = this.$echarts.init(chartDom4, 'dark');
var option4;
option4 = {
backgroundColor: '#000000',
// title: {
// text: '接口错误趋势'
// },
tooltip: {
trigger: 'axis',
axisPointer: {
type: 'shadow'
}
},
grid: {
left: '3%',
right: '4%',
bottom: '3%',
containLabel: true
},
xAxis: [{
type: 'category',
data: this.jiekouTime,
axisTick: {
alignWithLabel: true
}
}],
yAxis: [{
type: 'value',
splitLine: {
show: false
}
}],
series: [{
name: 'Direct',
type: 'bar',
barWidth: '60%',
data: this.jiekouErrorNumber,
color: {
type: 'linear',
x: 0,
y: 0,
x2: 1,
y2: 1,
colorStops: [{
offset: 0,
color: '#6BE6C1' // 0% 处的颜色
},
{
offset: 1,
color: '#1A70F3' // 100% 处的颜色
}
],
global: false // 缺省为 false
}
}]
};
myChart4.setOption(option4);
}
}
4. 3D 地球的绘制
- 3D地球主要采用了 echarts-gl 的技术,并非原创,是我们团队在曾经浏览的掘金文章中学到的。
源码如下~
import 'echarts-gl'
import titleComponent from './titleComponent.vue'
export default {
  name: 'SevenGraph',
  components: {
    titleComponent
  },
  data() {
    return {
      myChart: null,
      chartDom: null,
      na: '用户地区分布图'
    }
  },
  mounted() {
    this.chartDom = document.getElementById('globe')
    this.myChart = this.$echarts.init(this.chartDom)
    this.mapInit()
  },
  methods: {
    mapInit() {
      console.log('xxx')
      const url = 'https://p3-juejin.byteimg.com/tos-cn-i-k3u1fbpfcp/dbf199cb27ad46839fbab926b8f94e66~tplv-k3u1fbpfcp-zoom-in-crop-mark:3024:0:0:0.awebp?'
      this.myChart.setOption({
        backgroundColor: '#000', //背景颜色
        globe: {
          baseTexture: url, //地球的纹理。支持图片路径的字符串,图片或者 Canvas 的对象
          heightTexture: url, //地球的高度纹理
          shading: 'lambert', //地球中三维图形的着色效果
          light: {
            ambient: {
              intensity: 0.2, //环境光源强度
            }, //环境光
            main: {
              intensity: 0.8, //光源强度
            }, //主光源
          }, //光照设置
        },
        series: {
          type: 'lines3D',
          coordinateSystem: 'globe',
          blendMode: 'source-over',
          effect: {
            show: true,
          },
          lineStyle: {
            width: 1,
            color: 'rgb(255, 255,255)',
            opacity: 0.5,
            trailWidth: 4,
            trailLength: 0.01,
          }, //3D飞线图
          data: [
            [
              [112, 40, 2], // 终点的经纬度和海拔坐标
              [120, 20, 1], // 起点的经纬度和海拔坐标
            ],
            [
              [112, 40, 2],
              [20, -40, 1],
            ],
            [
              [112, 40, 2],
              [-60, 60, 1],
            ],
            [
              [112, 40, 2],
              [40, 0, 1],
            ],
            [
              [112, 40, 2],
              [-20, 20, 1],
            ],
            [
              [112, 40, 2],
              [-39, -40, 1],
            ],
            [
              [112, 40, 2],
              [67, 43, 1],
            ],
            [
              [112, 40, 2],
              [160, -18, 1],
            ],
            [
              [112, 40, 2],
              [145, 66, 1],
            ],
            [
              [112, 40, 2],
              [1790, 42, 1],
            ],
          ],
        },
      })
    },
  },
}
本章节我们主要介绍了首页的 Echarts 大屏如何绘制,相比你已经有了初步的理解。
那么我们前端监控系统的系列文章也即将走入尾声,其实前端监控系统的中台部分并不复杂,主要是 CSS 与 Echarts的运用,如何画出好看的页面,大概是值得我们一生努力探索的问题。
最后的最后,我们的反思~
项目的优点
可扩展性强
同时支持全局应用和组件级别应用
// 被监控网站的main.js
import revue, { httpError } from 'revue-monitor'
// 我们可以在mian.js中全局引入sdk
// 更灵活的,我们还可以再某个组件中,引入某个监控功能,这都是被允许的
Vue.use(revue.immediate)
个性化定制插件
// 利用发布订阅和单利模式存储一个全局的消息队列,且具有注册功能
// 我们在不同的插件处触发对应的生命周期钩子函数并给予在此处生命周期可以获取到的信息
// 当用户使用函数注册了某一个生命周期后,这个函数就成为了一个watcher
// 在某一个监控触发时(如js报错,js监控被触发),会自动执行对应watcher函数
class Topic {
  eventList = {}
  on(callback, event) {
    ;(this.eventList[event] || (this.eventList[event] = [])).push(callback)
  }
  emit(event, ...arr) {
    this.eventList[event] && this.eventList[event].forEach(e => {
      e(...arr)
    });
  }
}

const topic = new Topic()

export default topic

//注册函数绑定在revue上
function registLifecallBack(key, callBack) {
    topic.on(callBack, key)
}

let errorIds= []
export default  function myRecord(id) {
  errorIds.push(id)
}

function registLifecallBack(key, callBack) {
    topic.on(callBack, key)
}

//被监控网站的main.js
revue.registLifecallBack("onJsError", myRecord);
项目的问题
-
中台网站打开的渲染时间略长,仍需优化
-
插件的可扩展性和个性化定制功能不够强,仍需加强插件的扩展性与定制化
架构演进的可能性
对于当前的框架来说,在监控工具上,我们的最大特点便是专注于vue项目的监控。一方面,我们可以扩展更多的流行前端开发框架如React,svelte等项目,为这些主流的前端项目设计符合其特点的监控SDK。另一方面,我们可以利用我们的监测工具易拓展的特性,形成plugin的生态(建立在线的扩展插件仓库),集结更多的开发者完善监测工具。
在监控中台上,我们的可以将监控中台分为两个方向,一是用户自我落地的本地监控中台,我们提供更友好的使用文档和更加渐进式的中台框架(不用的模块就不必配置,框架根据配置动态加载);另外对于在线的监控中台,我们通过提供更优质和专业的服务,小团队免费试用,在线问题解答,数据存储和管理按量付费等,不断演进在线的监控中台框架。
- 源码链接在开头,欢迎大家与我们共建,也欢迎大家提出宝贵的意见!
那么前端监控系统文章就到此结束啦(完结撒花)~