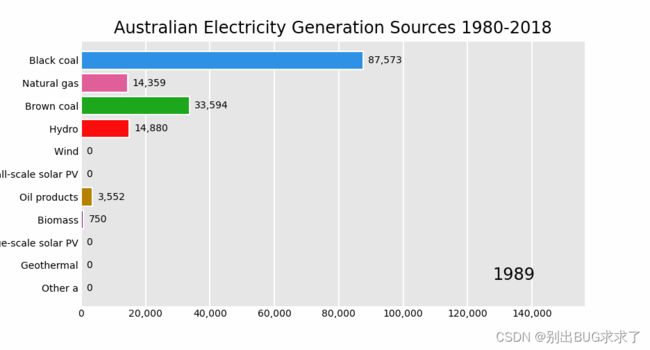
【数据处理】python使用matplotlib如何绘制动图;如何使用python进行动图gif制作;实时绘制动态图
一、现有的集成工具
绘制动图可以用一些现有的集成库,但是很麻烦,你需要调整和他们一样的参数和格式,定制化程度比较低,还得再去搞懂它们的东西。比如这些现有的:
https://github.com/JackMcKew/pandas_alive
二、多张图片的合成
使用Python PIL.Image 制作GIF图片:
import  PIL.Image                      # 相关模块
img = Image.open(img_name)                     # 打开图片
img.save(save_name,save_all = True,\append_images = imgs,duration = t)               #保存图片
- 打开图片后会得到一个对象,我们把这个对象放进列表。列表里的所有对象将被合成GIF图片
- 用这个列表作为参数之一,使用第0个对象调用save方法即可
- 参数解释save_all = True 设置此项,会保存所有图片对象,否则只保存一张
append_images = imgs        # imgs为存放对象们的列表
duration = t                           #  GIF动图的间隔时间
代码如下:
import imageio
def create_gif(image_list, gif_name, duration = 1.0):
    '''
    :param image_list: 这个列表用于存放生成动图的图片
    :param gif_name: 字符串,所生成gif文件名,带.gif后缀
    :param duration: 图像间隔时间
    :return:
    '''
    frames = []
    for image_name in image_list:
        frames.append(imageio.imread(image_name))

    imageio.mimsave(gif_name, frames, 'GIF', duration=duration)
    return

def main():
    #这里放上自己所需要合成的图片
    image_list = ['0.jpg', '1.jpg', '2.jpg']
    gif_name = 'baby.gif'
    duration = 0.2
    create_gif(image_list, gif_name, duration)

if __name__ == '__main__':
    main()
三、Python matplotlib.pyplot 绘制动态图
在matplotlib模块中使用最多的类是pyplot。pyplot位于matplotlib模块中脚本层为入门用户提供快速绘制折线、柱状、散点、饼图等图形方法,在matplotlib模块为用户提供快速绘制动态图,除了专门绘制的动态类animation类外,pyplot也提供绘制动态图相关方法。本期,我们将学习使用pyplot的绘制动态图相关方法
1. pyplot绘图显示模式
我们前面学习绘制的方法后,最后都会调用pyplot.show()方法,运行程序后才会显示图像。
在matplotlib模式中绘制图形通常有两种模式:
(1)block:阻塞模式
- 阻塞模式打开一个fig窗口后不会显示新fig窗口
- pyplot提供的绘制图形方法都是直接出图像,需要调用pyplot.show()才能显示图像
- 在Python脚本中,matplotlib默认是阻塞模式
- pyplot.show()在阻塞情况,为True
(2)interactive:交互模式
- 新创建的图像会立即显示
- 图表上的数据会根据变化而自动重新绘制
- 当使用交互模式下,需要确保事件循环正在运行具有响应数字
- 在python 命令行中,matplotlib 默认为交互模式
- pyplot.show 在交互模式下为False
(3)pyplot提供绘制动图的方法
| 方法 | 作用 |
|---|---|
| pyplot.ion() | 打开交互模式 |
| pyplot.ioff() | 关闭交互模式 |
| pyplot.clf() | 清除当前的画布figure对象 |
| pyplot.cla() | 清除当前Axes对象 |
| pyplot.pause() | 暂停功能 |
2. pyplot绘制动图步骤
- 导入绘制图形的matplotlib.pyplot模块
import matplotlib.pyplot as plt
- 调用pyplot.ion()方法打开交互模式
plt.ion()
- 使用numpy.linspace()、numpy.arange()等方法准备x,y轴数据
x = np.linspace(0,np.pi*i+1,1000)
y = np.cos(x)
- 调用pyplot.xlim(),pyplot.ylim()方法设置x,y轴坐标范围
plt.xlim(-0.2,20.4)
plt.ylim(-1.2,1.2)
- 调用pyplot提供绘制折线、柱状图等方法
plt.plot(x,y,color="pink")
- 使用for循环包含上述创建的x,y数据、x,y轴坐标、绘制图形方法,其中需要调用pyplot.cla()方法清空前一次Axes对象
plt.cla()
- 再调用pyplot.pause()暂停gonn
plt.pause(0.1)
- 当for循环结束后,需要调用pyplot.ioff()关闭交互模式已经pyplot.show显示图像
plt.ioff()
plt.show()
3. 例子
- 调用numpy.arange()准备x,y轴数据
- 调用pyplot.scatter()绘制散点图
- 使用for循环包含以上步骤,在for循环开始调用pyplot.ion()打开交互模式
- for循环结束后,调用pyplot.ioff()关闭交互模式
- 最后调用pyplot.show()展示图像画面
def scatter_plot():
    # 打开交互模式
    plt.ion()
    for index in range(50):
        # plt.cla()

        plt.title("动态散点图")
        plt.grid(True)

        point_count = 5
        x_index = np.random.random(point_count)
        y_index = np.random.random(point_count)

        color_list = np.random.random(point_count)
        scale_list = np.random.random(point_count) * 100

        plt.scatter(x_index, y_index, s=scale_list, c=color_list, marker="^")

        plt.pause(0.2)

    plt.ioff()

    plt.show()

