Python机器学习:Matplotlib
Python机器学习:Matplotlib
1、单图绘制
import random
import matplotlib.pyplot as plt

# 1、容器层
plt.figure(figsize=(6, 3), dpi=100)

# 2、辅助显示层
plt.yticks(range(40)[::2])  # y刻度
plt.xticks(range(60)[::5])  # x刻度
plt.grid(True)  # 添加网格
plt.ylabel("y")
plt.xlabel("x")
plt.title("x vs y")

# 3、图像层
x = range(60)
y1 = [random.uniform(0, 10) for i in x]
y2 = [random.uniform(5, 15) for i in x]

plt.plot(x, y1, color='r', label="y1", linestyle="-.")  # 折线图
plt.plot(x, y2, color='b', label="y2", linestyle="--")

plt.savefig('ML-01.png')    # 保存图像
plt.legend(loc="best")    # 显示图例
plt.show()  # 显示图像

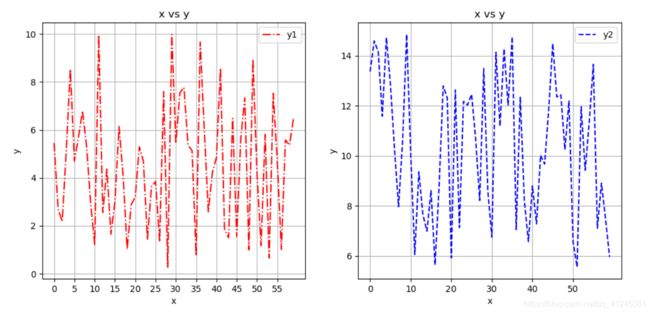
2、多图绘制
import random
import matplotlib.pyplot as plt

plt.figure(figsize=(6, 3), dpi=100)

x = range(60)
y1 = [random.uniform(0, 10) for i in x]
y2 = [random.uniform(5, 15) for i in x]

plt.subplot(1, 2, 1)
plt.yticks(range(40)[::2])
plt.xticks(range(60)[::5])
plt.grid(True)
plt.ylabel("y")
plt.xlabel("x")
plt.title("x vs y")
plt.plot(x, y1, color='r', label="y1", linestyle="-.")
plt.legend(loc="best")

plt.subplot(1, 2, 2)
plt.yticks(range(40)[::2])
plt.xticks(range(60)[::10])
plt.grid(True)
plt.ylabel("y")
plt.xlabel("x")
plt.title("x vs y")
plt.plot(x, y2, color='b', label="y2", linestyle="--")
plt.legend(loc="best")

plt.savefig('ML-01.png')
plt.show()
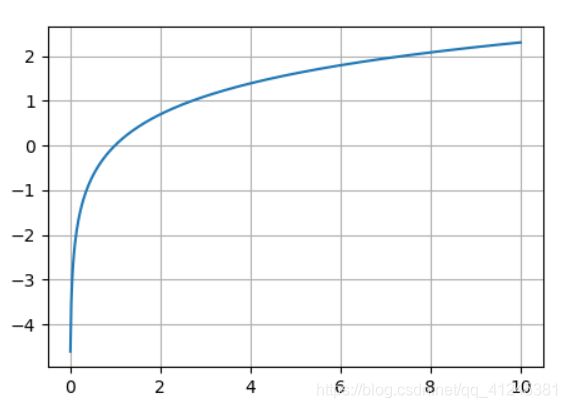
3、数学图像
import numpy as np
import matplotlib.pyplot as plt

plt.figure()
plt.grid(True)

x = np.linspace(-10, 10, 1000)
y = np.log(x)

plt.plot(x, y)
plt.show()
4、散点图
import matplotlib.pyplot as plt
import random

x = range(100)
y = [random.uniform(1, 10) for i in range(100)]

plt.figure()
plt.scatter(x, y)

plt.show()

5、柱状图
import matplotlib.pyplot as plt
import random

x = range(10)
y = [random.uniform(1, 10) for i in range(10)]

plt.figure()
plt.bar(x, y)

plt.show()
