go pprof
前提
Windows安装graphviz
下载地址: http://www.graphviz.org/download/
添加环境变量:(默认)C:\Program Files\Graphviz 2.44.1\bin
注:验证是否安装成功
C:\WINDOWS\system32>dot -version
dot - graphviz version 2.44.1 (20200629.0846)
There is no layout engine support for "dot"
Perhaps "dot -c" needs to be run (with installer's privileges) to register the plugins?
C:\WINDOWS\system32>dot -c

C:\WINDOWS\system32>dot -version
dot - graphviz version 2.44.1 (20200629.0846)
libdir = "C:\Program Files\Graphviz 2.44.1\bin"
Activated plugin library: gvplugin_dot_layout.dll
Using layout: dot:dot_layout
Activated plugin library: gvplugin_core.dll
Using render: dot:core
Using device: dot:dot:core
The plugin configuration file:
        C:\Program Files\Graphviz 2.44.1\bin\config6
                was successfully loaded.
    render      :  cairo dot dot_json fig gdiplus json json0 map mp pic ps svg tk vml xdot xdot_json
    layout      :  circo dot fdp neato nop nop1 nop2 osage patchwork sfdp twopi
    textlayout  :  textlayout
    device      :  bmp canon cmap cmapx cmapx_np dot dot_json emf emfplus eps fig gif gv imap imap_np ismap jpe jpeg jpg json json0 metafile mp pdf pic plain plain-ext png ps ps2 svg tif tiff tk vml xdot xdot1.2 xdot1.4 xdot_json
    loadimage   :  (lib) bmp eps gif jpe jpeg jpg png ps svg
执行dot -c是需要以管理员身份允许,否则会报如下错误
C:\Users\admin>dot -version
dot - graphviz version 2.44.1 (20200629.0846)
There is no layout engine support for "dot"
Perhaps "dot -c" needs to be run (with installer's privileges) to register the plugins?

C:\Users\admin>dot -c
Error: failed to open C:\Program Files\Graphviz 2.44.1\bin\config6 for write.
Centos安装graphviz
yum install graphviz
测试程序
package main

import (
	"net/http"
	_ "net/http/pprof"    //只需要引入此包即可
	"time"
)

var testMap  =  make(map[string]string)


func main()  {

	go func() {
		for  {
            //不停的向map中添加数据
			testMap[time.Now().String()] = time.Now().String()
		}
	}()

	if err := http.ListenAndServe("127.0.0.1:8080", nil); err != nil{
		panic(err)
	}
}
访问/debug/pprof

下载profile文件
点击页面上的 profile 或者执行下面的命令
go tool pprof  http://127.0.0.1:8080/debug/pprof/profile

执行示例
G:\repository\gopath\src\pprof-demo>go tool pprof  http://127.0.0.1:8080/debug/pprof/profile
Fetching profile over HTTP from http://127.0.0.1:8080/debug/pprof/profile
Saved profile in C:\Users\admin\pprof\pprof.samples.cpu.001.pb.gz
Type: cpu
Time: Jan 1, 2021 at 10:11am (CST)
Duration: 30.12s, Total samples = 34.06s (113.07%)
Entering interactive mode (type "help" for commands, "o" for options)
(pprof) exit

G:\repository\gopath\src\pprof-demo>
启动pprof 可视化界面
使用浏览器点击pprof链接生成文件的默认地址
go tool pprof -http 127.0.0.1:8081 C:\Users\admin\Downloads\profile

使用go tool生成的文件默认地址
go tool pprof -http 127.0.0.1:8081 C:\Users\admin\pprof\pprof.samples.cpu.001.pb.gz
VIEW->Flame Graph
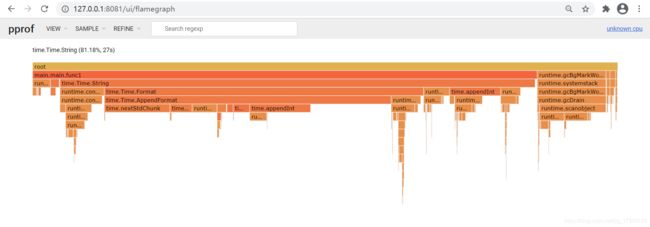
30秒的统计中,可以看出main包中main方法的func1(也就是go命令新起协程用的无名方法)最耗费CPU,进而往下看是time.Time.String也就是当前时间转字符串的时候最耗费CPU,将鼠标放到对应的方法上面会看到在统计期间81.18%的时间花费在该方法
参考链接:
https://www.jianshu.com/p/4e4ff6be6af9