Echarts饼图无法切换漏斗图问题处理
项目中有饼状图切换漏斗图的需求,个人实现历程,记录下。
1. 去官网查询饼图如何切换漏斗图;
https://www.echartsjs.com/examples/zh/editor.html?c=pie-roseType

然并卵,虽然饼图出来了,然而并没有切换漏斗图的图标,看来官网示例也有bug哦;
2. 排查原因;
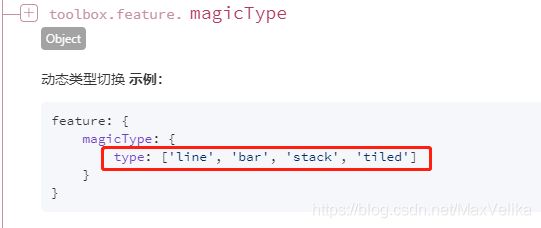
查看官方文档,发现toolbox-feature-magicType-type属性中只有line. bar. stack. tiled四个值,并无funnel漏斗属性值;
继续排查,发现echarts版本不一致导致
2.0和3.0 引入的文件不一样;
2.0版 : echarts-all.js
3.0版: echarts.min.js
3. 引入echarts2,重新绘制饼图;
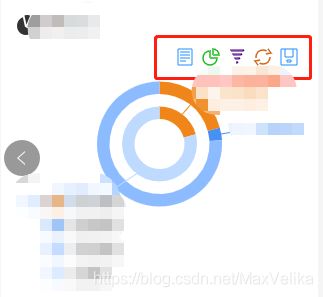
完美解决;
附部分代码:
html:
js:
var option = {
color:['#8378e8','#ff7171','#feda5f','#60dea7','#9a6dec','#40dde1','#38a1d9','#e690d0','#e3387c','#4ba4f7','#ffb771','#96bffd','#e062ac','#e7bcf2','#fe9e7f','#9d96f3'],
tooltip: {
trigger: 'item',
formatter: "{a}
{b} : {c} (L)"
},
legend: {
orient: 'vertical',
x: 'left',
data: []
},
toolbox: {
show: true,
feature: {
dataView: {show: true, readOnly: false},
magicType: {
show: true,
type: ['pie', 'funnel']
},
restore: {show: true},
saveAsImage: {show: true}
}
},
calculable: false,
series: [
{
name: '数据描述',
type: 'pie',
selectedMode: 'single',
radius: [0, 70],
x: '20%',
width: '40%',
funnelAlign: 'right',
itemStyle: {
normal: {
label: {
position: 'inner'
},
labelLine: {
show: false
}
}
},
data: []
},
{
name: '数据描述',
type: 'pie',
radius: [100, 140],
x: '60%',
width: '35%',
funnelAlign: 'left',
data: []
}
]
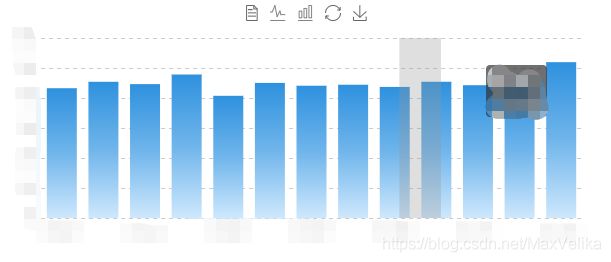
};当然了,高版本换低版本也会出现其他问题;
比如柱状图渐变属性没有;
3.0
itemStyle: {
    normal: {
        color: new echarts.graphic.LinearGradient(
            0, 0, 0, 1,
            [
                {offset: 0, color: '#2E91DE'},
                {offset: 0.5, color: '#70B5EB'},
                {offset: 1, color: '#CEE8FD'}
            ]
        )
    }
}
2.0
series: [{
    type: 'bar',
    barMaxWidth:'36',
    data: [],
    label: {
        normal: {
            show: true,
        }
    }
}]

编写不易,如有帮助到您,麻烦点个赞,感谢!